Open Access
Fig. 1.
Download original image
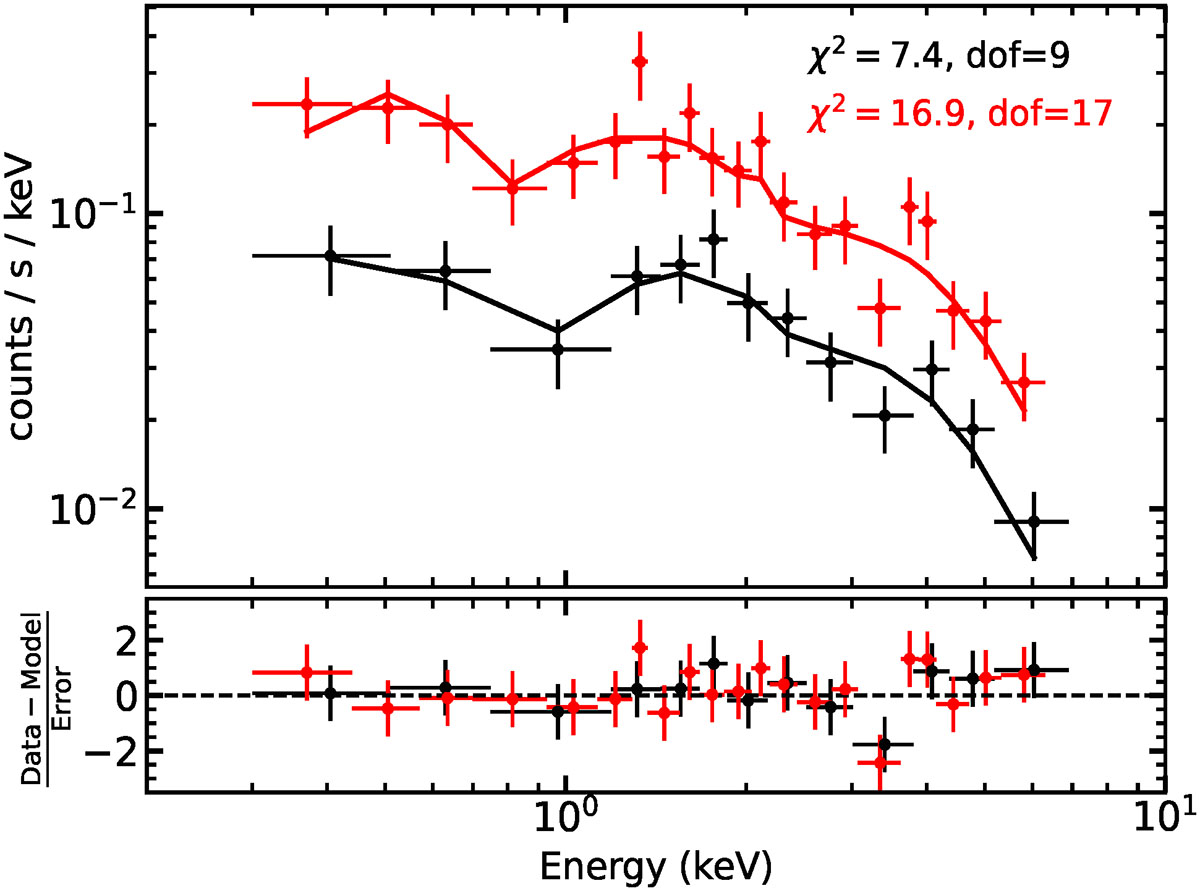
Swift/XRT spectra for an observation with a low count rate (black points) and an observation with a high count rate (red points). The black and red lines show the best-fitting model of Eq. (3). The bottom panel shows the best-fit residuals.
Current usage metrics show cumulative count of Article Views (full-text article views including HTML views, PDF and ePub downloads, according to the available data) and Abstracts Views on Vision4Press platform.
Data correspond to usage on the plateform after 2015. The current usage metrics is available 48-96 hours after online publication and is updated daily on week days.
Initial download of the metrics may take a while.