Fig. 3.
Download original image
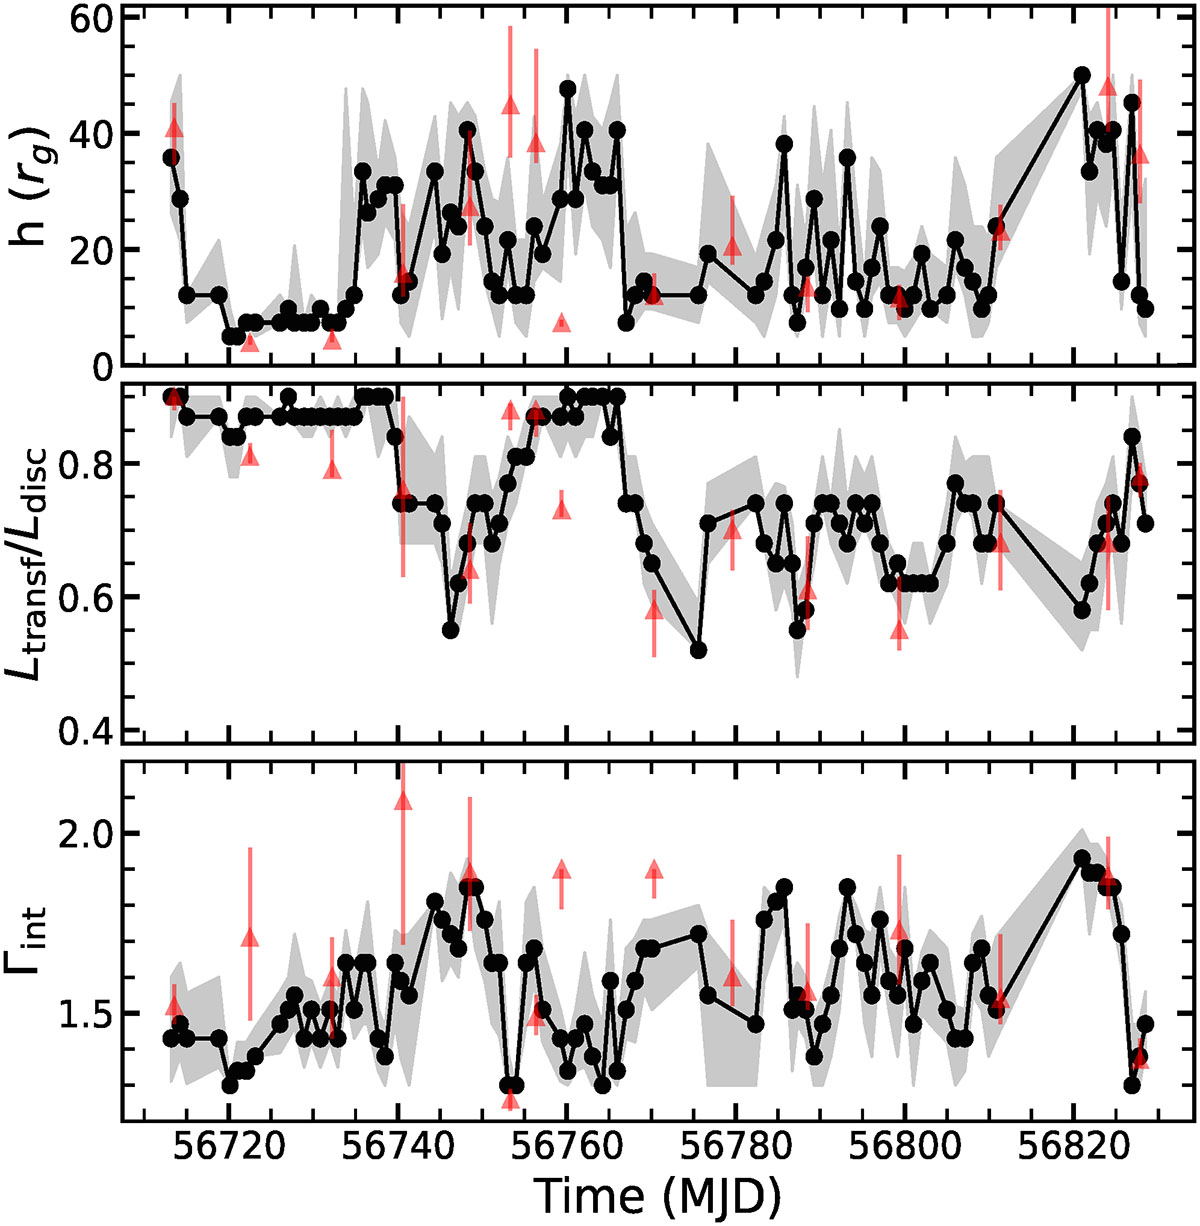
Best-fit parameters. Height (top panel), Ltransf/Ldisc (middle panel), and photon index (bottom panel). The grey shaded area shows the 1σ confidence interval, which we computed by repeating the fitting procedure 100 times, each time resampling the X-ray light curve from Gaussian distributions centred on the measured values with standard deviations equal to their error bar. For computational efficiency, these fits were performed using a coarser parameter grid (i.e. 10 values per parameter instead of 20). The red triangle points show the results of K24.
Current usage metrics show cumulative count of Article Views (full-text article views including HTML views, PDF and ePub downloads, according to the available data) and Abstracts Views on Vision4Press platform.
Data correspond to usage on the plateform after 2015. The current usage metrics is available 48-96 hours after online publication and is updated daily on week days.
Initial download of the metrics may take a while.