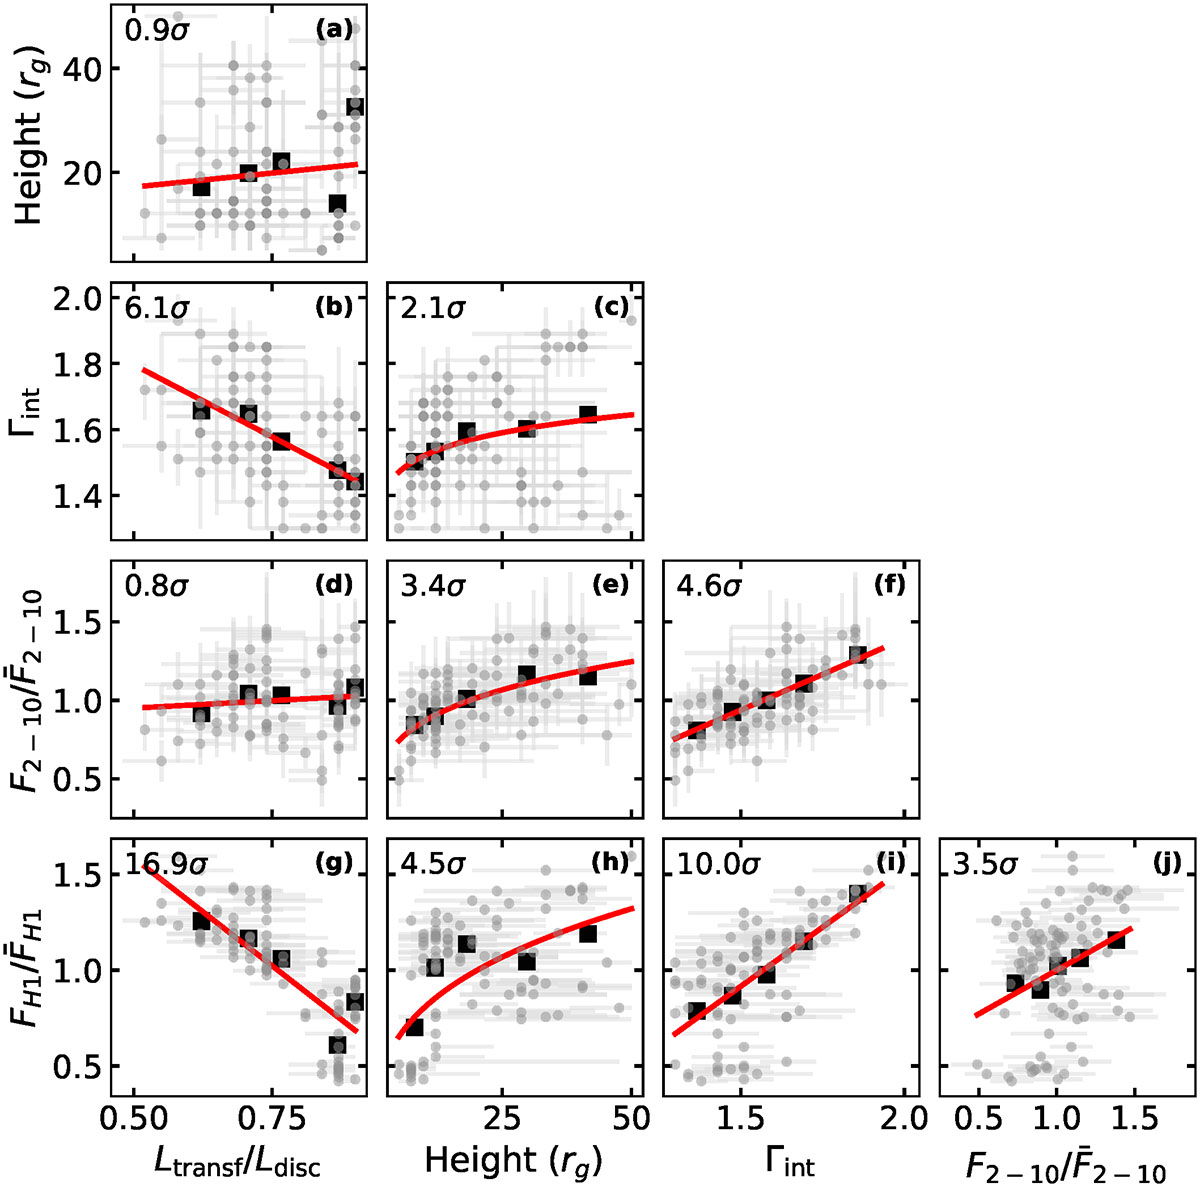
Fig. 4.
Download original image
Correlations between the best-fit parameters i.e. the height, the photon index, and the energy transferred to the corona) and the X-ray (2–10 keV) and UV observed fluxes. The red lines show the best-fit straight line or power-law model, and the black squares show the binned data. The numbers in each plot show the significance at which each slope is different from zero.
Current usage metrics show cumulative count of Article Views (full-text article views including HTML views, PDF and ePub downloads, according to the available data) and Abstracts Views on Vision4Press platform.
Data correspond to usage on the plateform after 2015. The current usage metrics is available 48-96 hours after online publication and is updated daily on week days.
Initial download of the metrics may take a while.