Fig. 1
Download original image
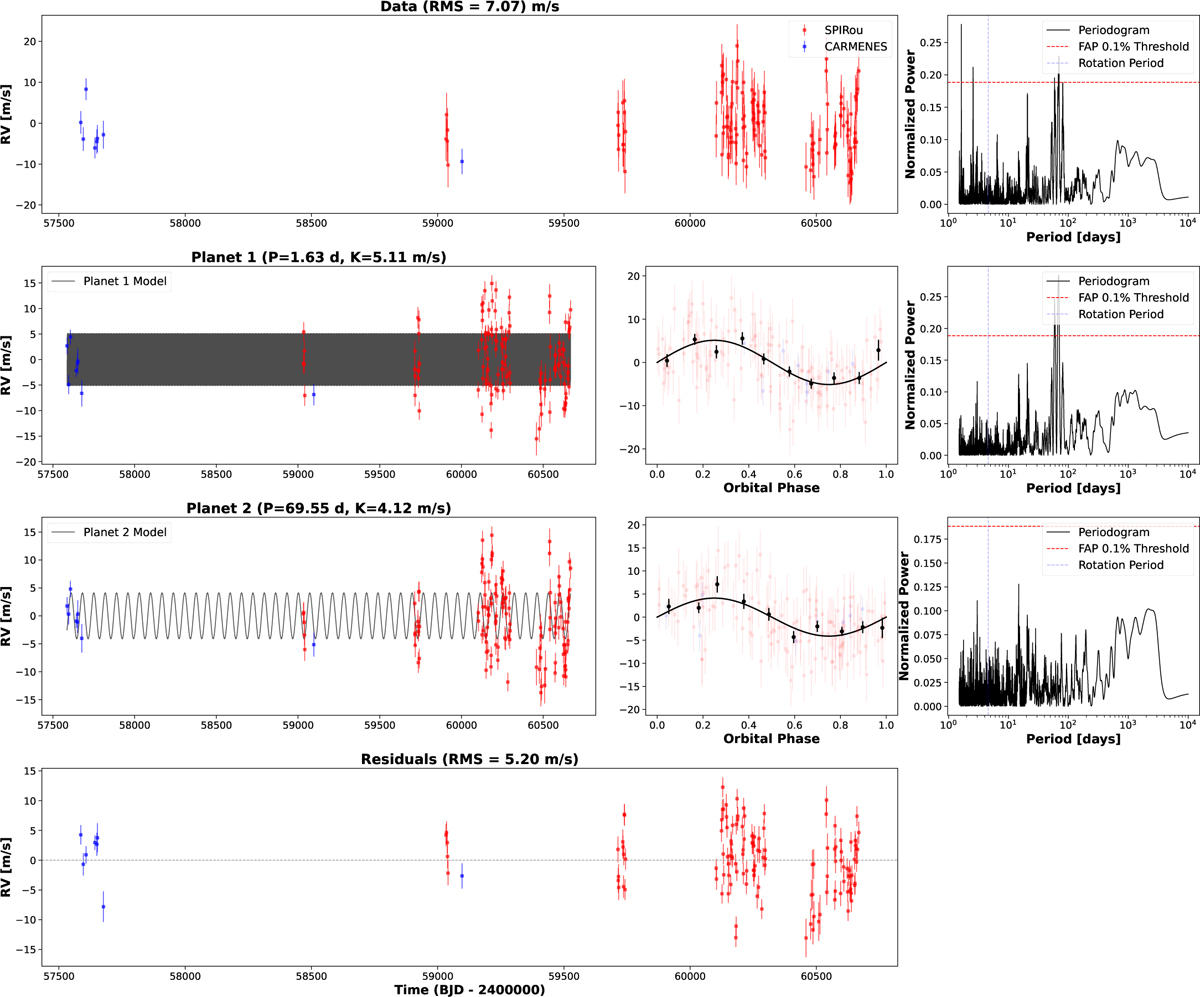
Radial velocity (RV) analysis of GJ 4274. The top row shows the raw RV data with offsets removed (RMS = 7.06 m/s). The second and third rows display the contributions of planets b and c to the RV signal, respectively, along with their phase-folded RV curves. The RV data in the left panel for planet c are the residuals of the contribution of planet b. The bottom panel presents the residuals after removing all modeled signals (RMS = 5.20 m/s). The rightmost column contains the periodograms, which highlight significant periods in the RV data at each step. The significance level of FAP = 10−3 is indicated by the horizontal dashed red line.
Current usage metrics show cumulative count of Article Views (full-text article views including HTML views, PDF and ePub downloads, according to the available data) and Abstracts Views on Vision4Press platform.
Data correspond to usage on the plateform after 2015. The current usage metrics is available 48-96 hours after online publication and is updated daily on week days.
Initial download of the metrics may take a while.