Fig. 10
Download original image
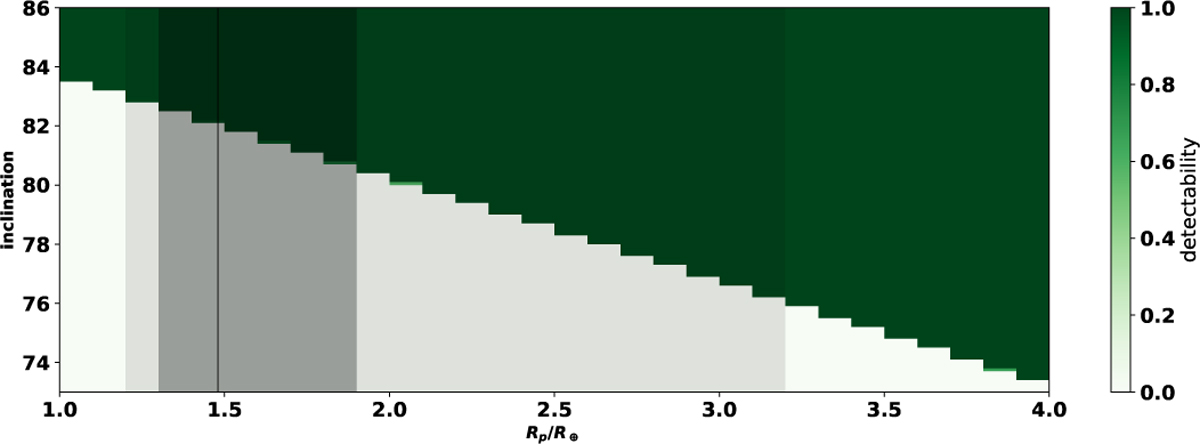
Detectability of planet b transit in TESS light curves of GJ 4274 versus orbital inclination and planetary radius. Colors indicate the detection probability, as described in Sect. 5.3. The shaded gray area shows the predicted radius range corresponding to the planet minimum mass, with the darkest shade representing the 64% confidence interval and the lightest shade the 95% interval. The vertical gray line marks the median value derived using spright.
Current usage metrics show cumulative count of Article Views (full-text article views including HTML views, PDF and ePub downloads, according to the available data) and Abstracts Views on Vision4Press platform.
Data correspond to usage on the plateform after 2015. The current usage metrics is available 48-96 hours after online publication and is updated daily on week days.
Initial download of the metrics may take a while.