Fig. 2
Download original image
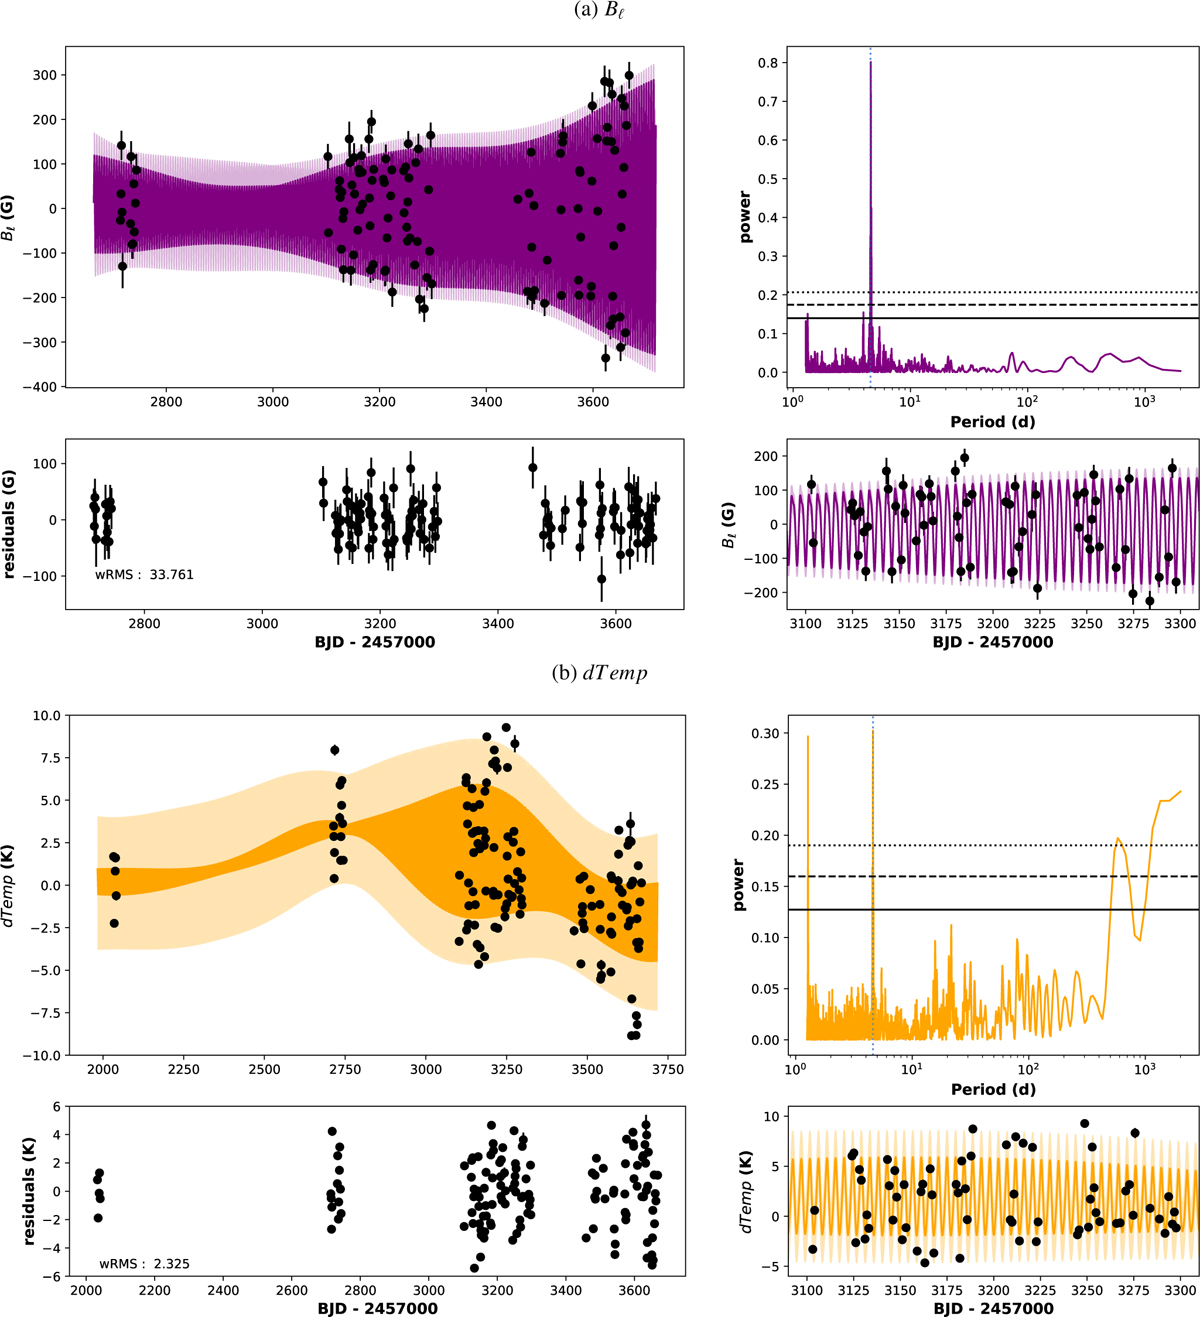
Time series, periodograms, and Gaussian process (GP) regression fits for the activity indicators Bℓ (upper panel) and dTemp (lower panel). Each panel is divided into four subpanels. The upper-left subpanel shows the time series of this indicator (black dots), along with its GP fit (colored lines). The same, focused on the 2023 observations, are shown in the lower-right subpanel. The residuals of these fits are in the bottom subpanel. The upper-right subpanel displays the Lomb-Scargle periodogram of the activity indicator. In these subpanels, the vertical dashed blue line marks the known rotation periods of GJ 4274 (Prot = 4.59 d). The horizontal black lines (solid, dashed, and dotted) indicate false alarm probabilities (FAPs) of 10%, 1%, and 0.1%, respectively.
Current usage metrics show cumulative count of Article Views (full-text article views including HTML views, PDF and ePub downloads, according to the available data) and Abstracts Views on Vision4Press platform.
Data correspond to usage on the plateform after 2015. The current usage metrics is available 48-96 hours after online publication and is updated daily on week days.
Initial download of the metrics may take a while.