Open Access
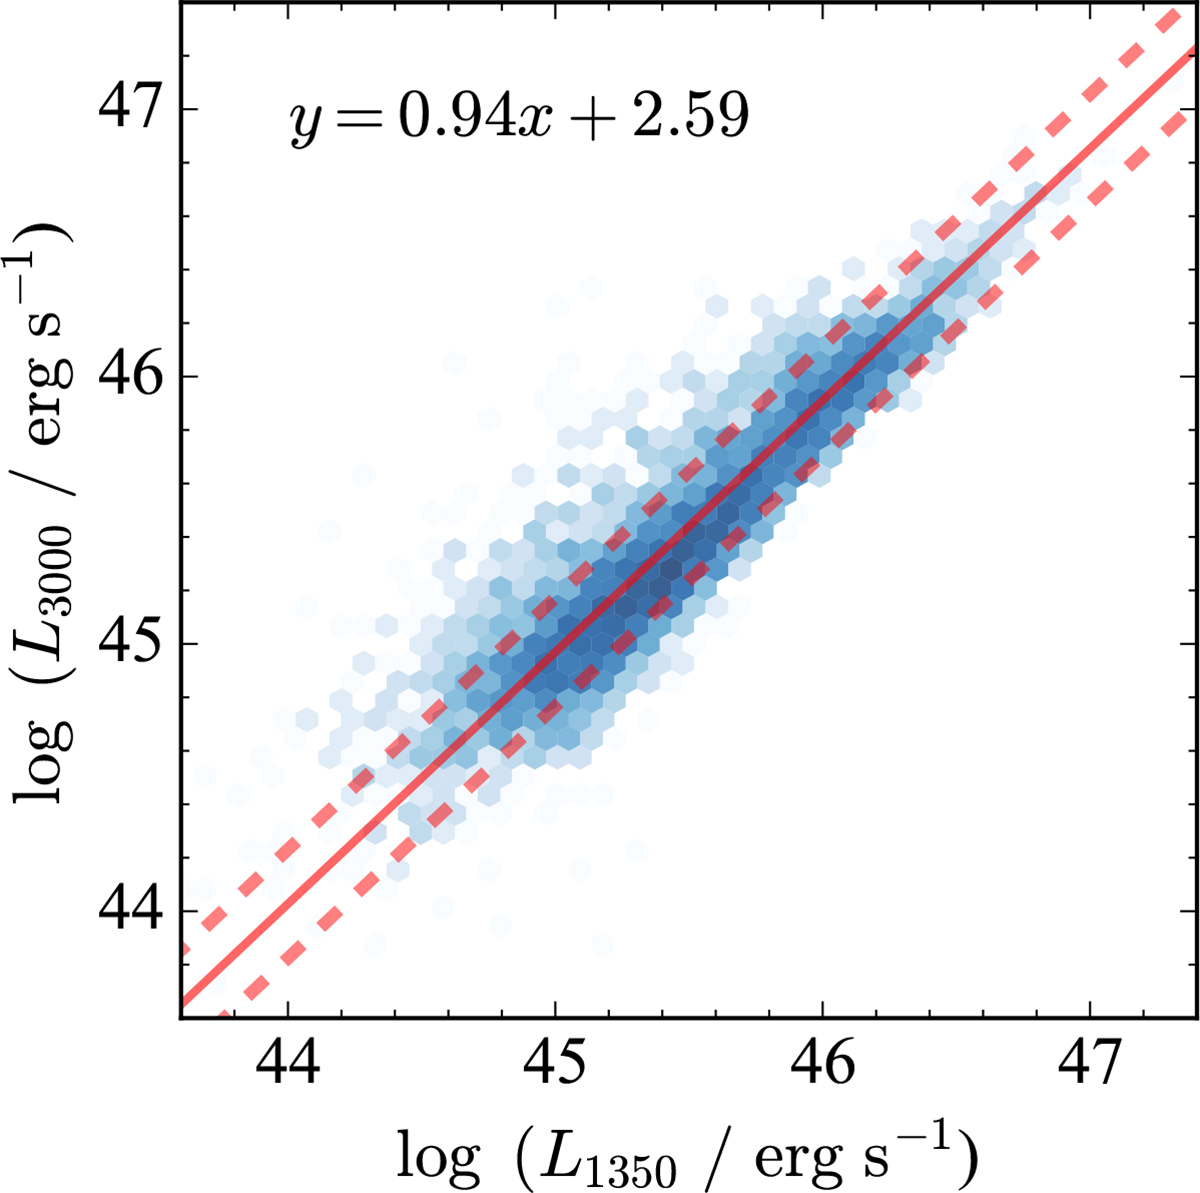
Fig. 1.
Download original image
Density distributions of luminosities at 1350 Å and 3000 Å for our sample. The solid and dashed red lines denote the best regression and its 1σ scatter, respectively. The best-fit result displayed in the panel was used to convert between the two luminosities.
Current usage metrics show cumulative count of Article Views (full-text article views including HTML views, PDF and ePub downloads, according to the available data) and Abstracts Views on Vision4Press platform.
Data correspond to usage on the plateform after 2015. The current usage metrics is available 48-96 hours after online publication and is updated daily on week days.
Initial download of the metrics may take a while.