Open Access
Fig. 4
Download original image
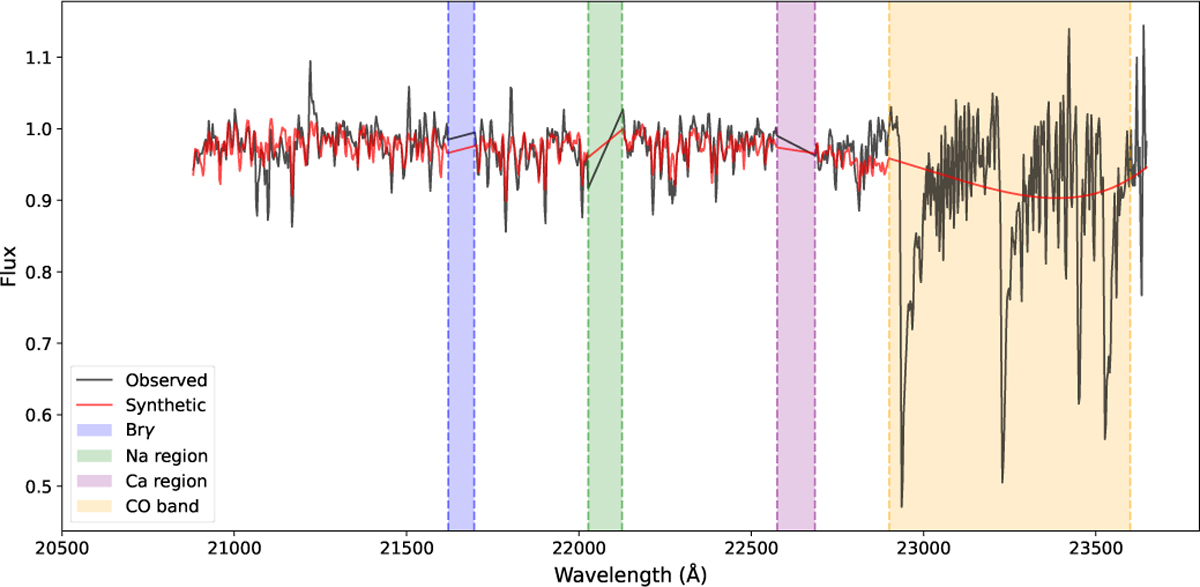
Example of a spectral fit using STARKIT for starId 30001001. The normalized observed spectrum is in black; the best synthetic fit is indicated in red. The vertical bands show the masks applied: blue is the Brγ region, green the region around the NaI line, magenta the region around the CaI line, and orange the CO band heads.
Current usage metrics show cumulative count of Article Views (full-text article views including HTML views, PDF and ePub downloads, according to the available data) and Abstracts Views on Vision4Press platform.
Data correspond to usage on the plateform after 2015. The current usage metrics is available 48-96 hours after online publication and is updated daily on week days.
Initial download of the metrics may take a while.