Fig. 5
Download original image
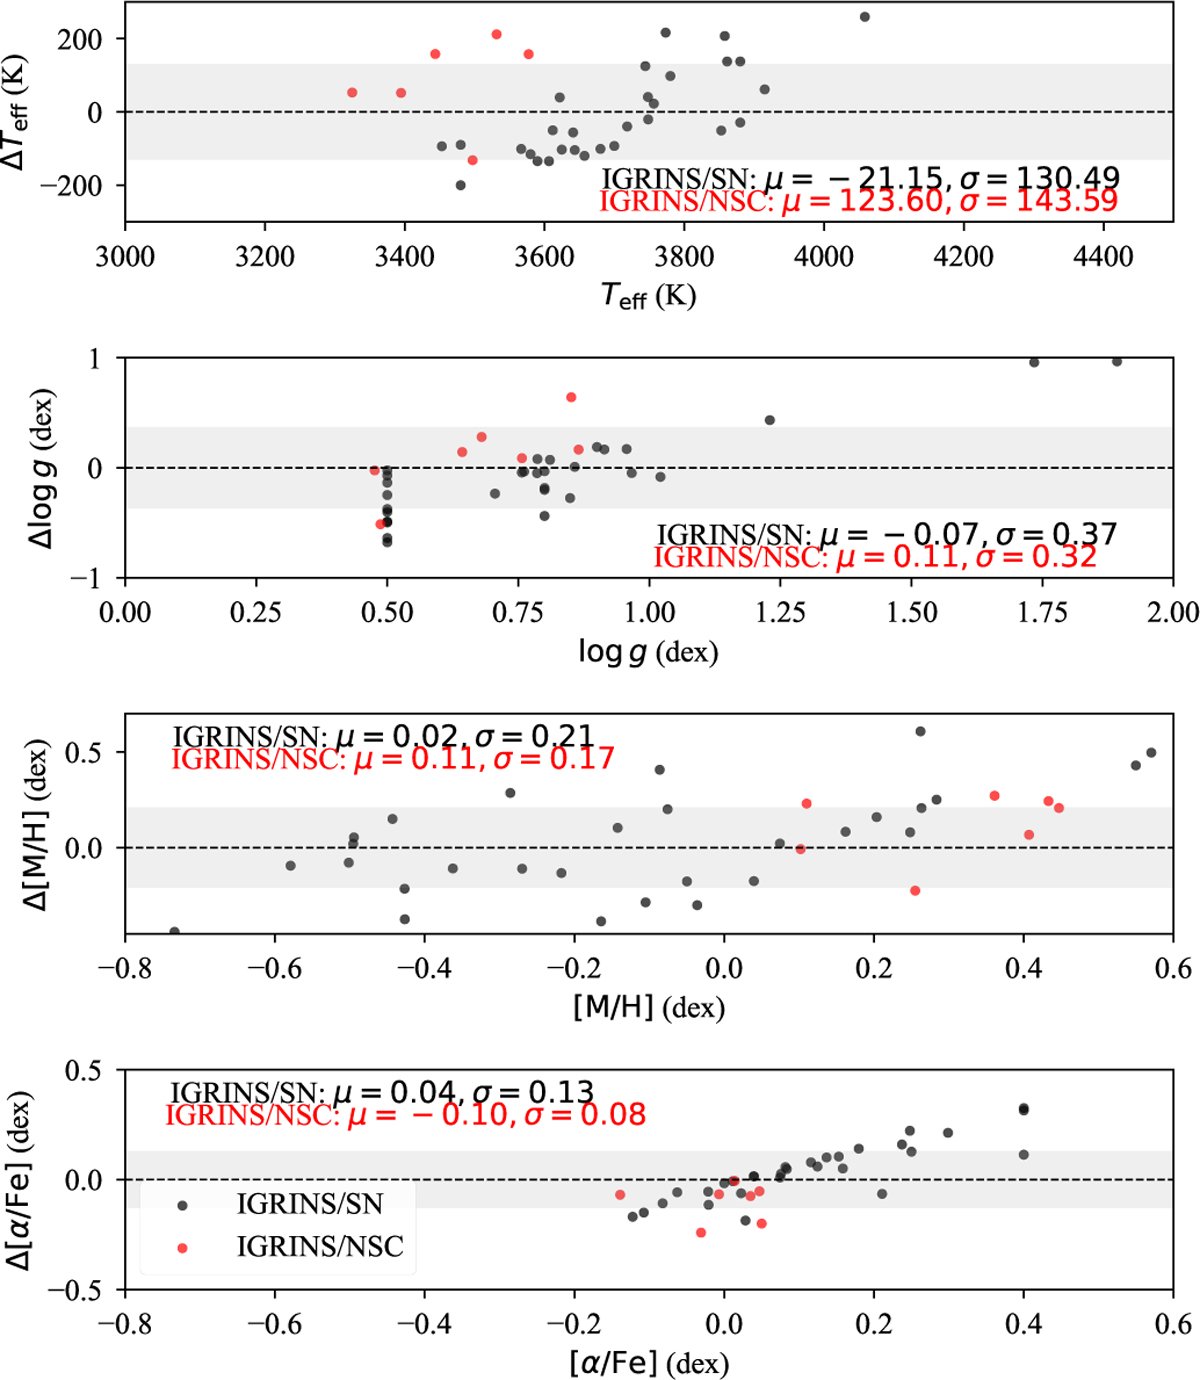
Comparison between stellar parameters of high-resolution spectra to degraded spectra at the resolution of KMOS. The y-axis shows the difference between low-resolution and high-resolution spectra, respectively, while the x-axis displays the value from the low-resolution work. The shaded grey area shows ± 1 σ levels for each parameter comparison. The mean difference and standard deviations are indicated at the upper right. The black dots show the SN sample, while the red dots the NSC stars from Nandakumar et al. (2025).
Current usage metrics show cumulative count of Article Views (full-text article views including HTML views, PDF and ePub downloads, according to the available data) and Abstracts Views on Vision4Press platform.
Data correspond to usage on the plateform after 2015. The current usage metrics is available 48-96 hours after online publication and is updated daily on week days.
Initial download of the metrics may take a while.