Fig. 8
Download original image
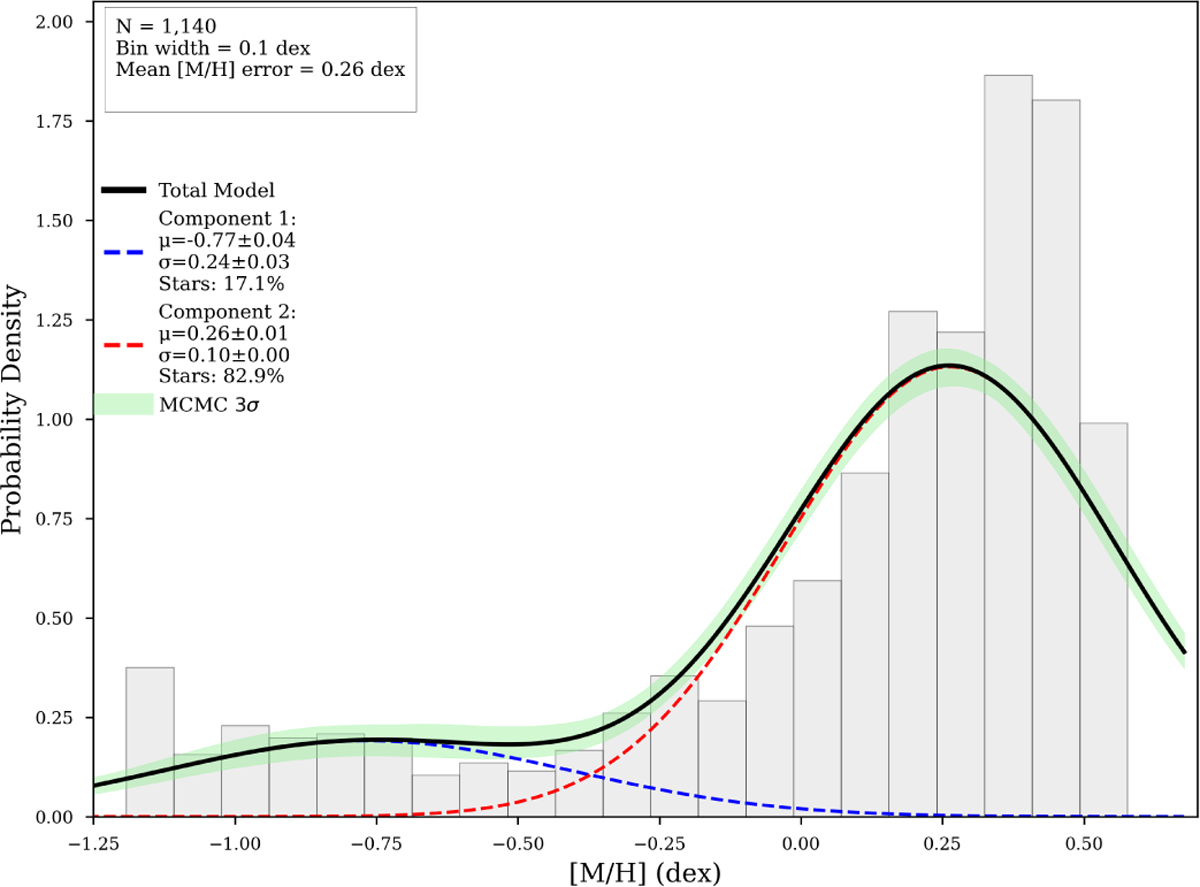
Metallicity distribution function of our sample. A two-component GMM model is superposed. The first component is centred at −0.76 dex with a standard deviation of 0.24 dex, while the second component is centred at +0.26 dex with a std of 0.10 dex. The blue dashed lines represents the Gaussian fit for the metal-poor population, while the red dashed lines are for the metal-rich population. The total model is displayed with a solid black line together with the 3 σ uncertainties.
Current usage metrics show cumulative count of Article Views (full-text article views including HTML views, PDF and ePub downloads, according to the available data) and Abstracts Views on Vision4Press platform.
Data correspond to usage on the plateform after 2015. The current usage metrics is available 48-96 hours after online publication and is updated daily on week days.
Initial download of the metrics may take a while.