Fig. 9
Download original image
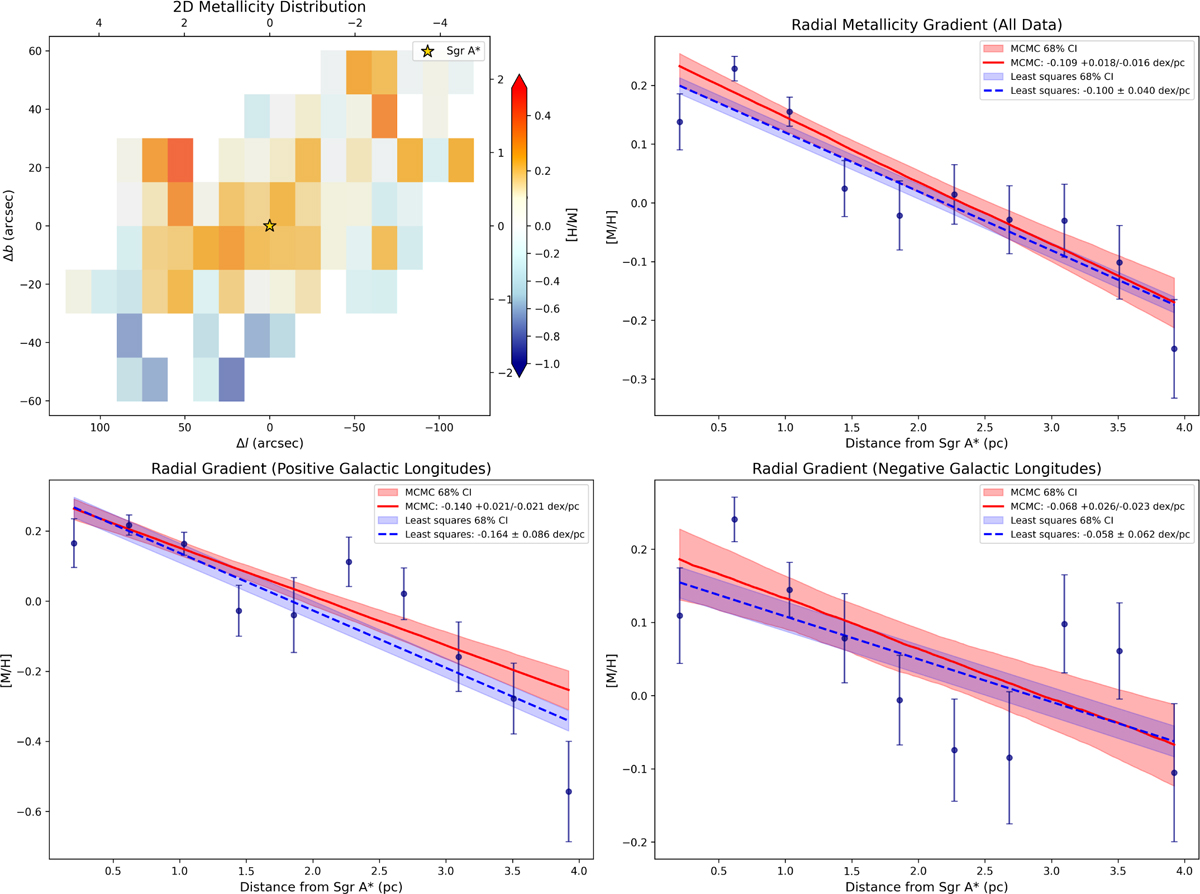
(Upper left panel): mean metallicities in offset coordinates from Sgr A*. Galactic north is up. Each of the bins has at least five stars. (Upper right panel): mean metallicity as a function of the distance from Sgr A* (in pc). The error bars indicate the standard error of the mean metallicity within each bin (each bin has at least five stars). The blue dashed line shows the linear least-squares fit with the 95% confidence interval shown as the blue area. The red lines show the Bayesian MCMC analysis with the median prediction from the MCMC samples and the red area indicates the 16th–84th percentile uncertainty range from the MCMC posterior predictions. (Lower left panel): similar to the upper right panel, but only for positive Galactic longitudes. (Lower right panel): similar to upper right panel, but only for negative Galactic longitudes.
Current usage metrics show cumulative count of Article Views (full-text article views including HTML views, PDF and ePub downloads, according to the available data) and Abstracts Views on Vision4Press platform.
Data correspond to usage on the plateform after 2015. The current usage metrics is available 48-96 hours after online publication and is updated daily on week days.
Initial download of the metrics may take a while.