Open Access
Fig. 3.
Download original image
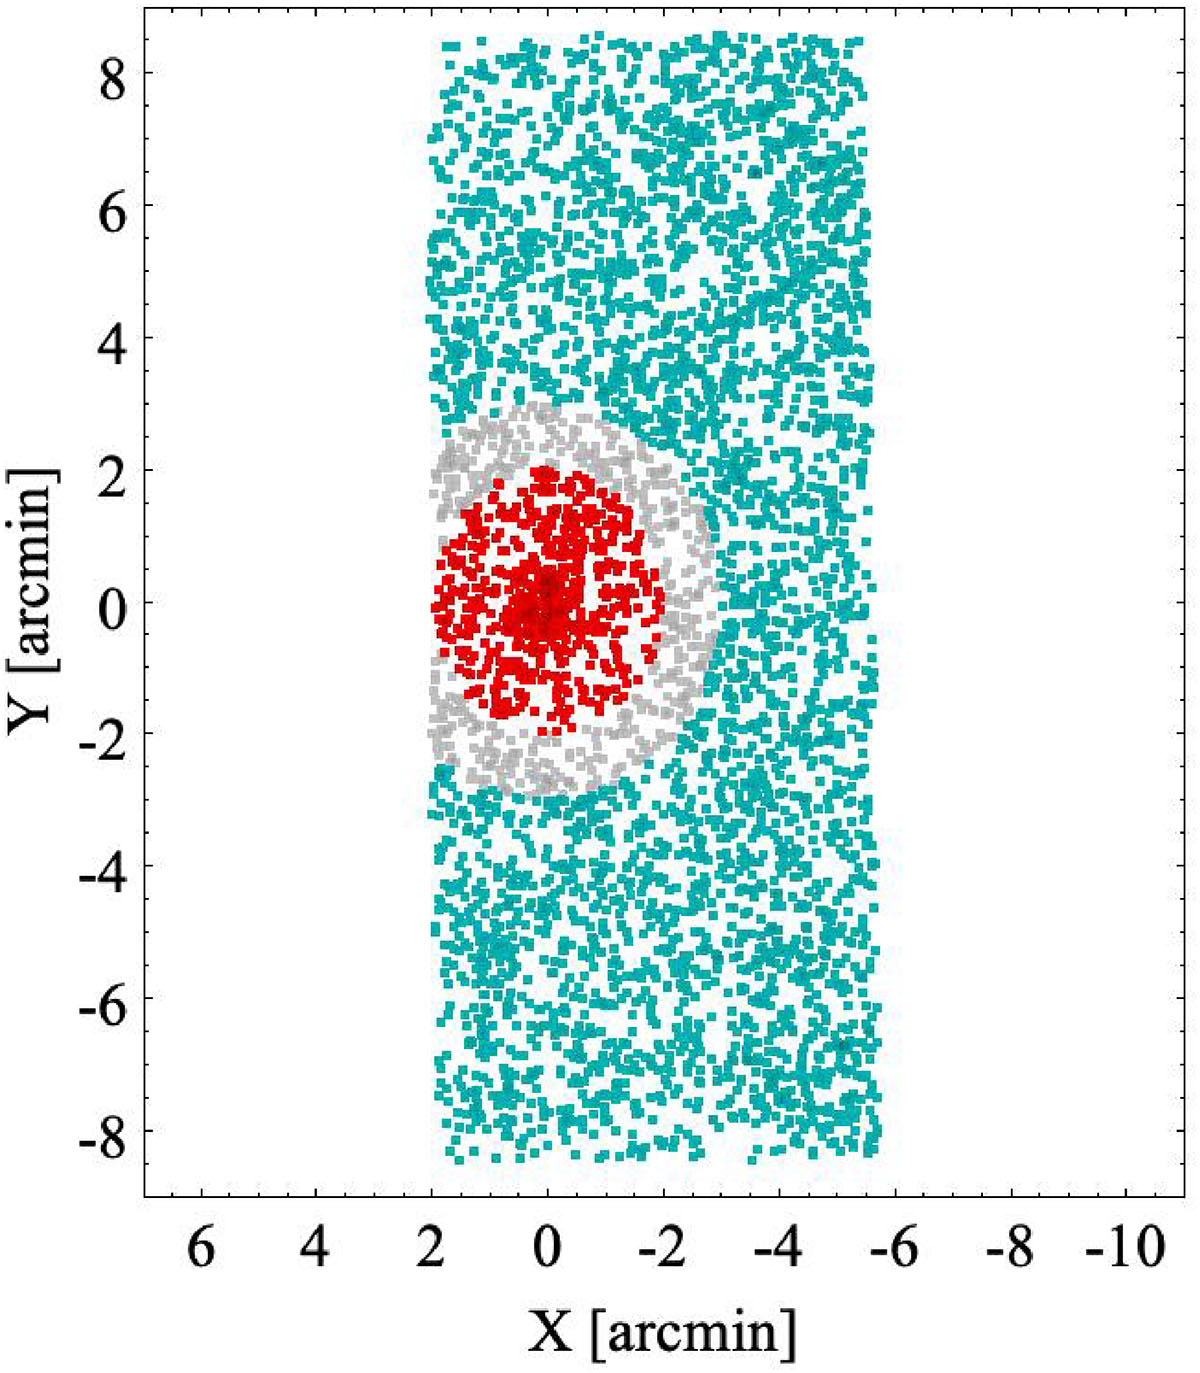
Sky map of the position of the sources in our selected catalogue, in an orthographic projection reference system with the origin at the centre of KK 153. North is up, east to the left. Sources within 2.0′ from the centre of KK 153 are plotted in red (galaxy), sources with R > 3.0′ are plotted in cyan (field).
Current usage metrics show cumulative count of Article Views (full-text article views including HTML views, PDF and ePub downloads, according to the available data) and Abstracts Views on Vision4Press platform.
Data correspond to usage on the plateform after 2015. The current usage metrics is available 48-96 hours after online publication and is updated daily on week days.
Initial download of the metrics may take a while.