| Issue |
A&A
Volume 705, January 2026
|
|
|---|---|---|
| Article Number | A253 | |
| Number of page(s) | 8 | |
| Section | Extragalactic astronomy | |
| DOI | https://doi.org/10.1051/0004-6361/202557872 | |
| Published online | 23 January 2026 | |
Red giant branch tip distance to the faint gas-rich dwarf KK 153
1
INAF – Osservatorio di Astrofisica e Scienza dello Spazio di Bologna Via Piero Gobetti 93/3 40129 Bologna, Italy
2
European Southern Observatory Karl-Schwarzschild-Strasse 2 85748 Garching bei München, Germany
3
INAF – Osservatorio Astronomico di Roma Via Frascati 33 00078 Monteporzio Catone Rome, Italy
★ Corresponding author: This email address is being protected from spambots. You need JavaScript enabled to view it.
Received:
28
October
2025
Accepted:
21
November
2025
Abstract
KK 153 is a star-forming dwarf galaxy that has been recently proposed as a new member of the sparsely populated class of gas-rich ultra-faint dwarfs that lie in the outskirts of the Local Group. We used the Large Binocular Telescope under sub-arcsec seeing conditions to resolve the outer regions of KK 153 into individual stars for the first time, reaching the red giant branch. The magnitude of the red giant branch tip was used to measure a distance of D = 3.06−.014+0.17 Mpc, which is much more accurate and precise than the estimate previously available in the literature, based on the baryonic Tully-Fisher relation (D = 2.0−0.8+1.7 Mpc). The new distance places KK 153 clearly beyond the boundaries of the Local Group, and, together with a new measurement of the integrated magnitude, implies a stellar mass of M★ = 2.4 ± 0.2 × 10⁶ M⊙. The dwarf populates the extreme low-mass tail of the M★ distribution of gas-rich galaxies but it is significantly more massive than the faintest local gas-rich dwarfs, Leo T and Leo P. In an analogy with similar systems, the star formation history of KK 153 may have been impacted by the re-ionisation of the Universe while keeping a sufficient gas reservoir to form new stars several Gigayear later.
Key words: galaxies: dwarf / galaxies: individual: KK 153
© The Authors 2026
 Open Access article, published by EDP Sciences, under the terms of the Creative Commons Attribution License (https://creativecommons.org/licenses/by/4.0), which permits unrestricted use, distribution, and reproduction in any medium, provided the original work is properly cited.
This article is published in open access under the Subscribe to Open model. This email address is being protected from spambots. You need JavaScript enabled to view it. to support open access publication.
1. Introduction
The exploration of the very faint end of the galaxy luminosity function is a fascinating endeavour that can only be pursued in the local Universe, where extremely faint stellar systems can actually be detected (Belokurov 2013; Simon 2019). One of the techniques that has been used in the last decade to look for very faint nearby galaxies, down to the regime of almost dark (Cannon et al. 2015; Giovanelli & Haynes 2015; Sand et al. 2015a; Leisman et al. 2017, 2021; Jones et al. 2023) or, possibly, completely dark systems (Anand et al. 2025), has been to search for stellar counterparts of compact H I clouds whose low line-of-sight (los) velocity is compatible with a local nature (see, e.g., Adams et al. 2013; Saul et al. 2014, for recent catalogues of such clouds). Systematic searches led to the discovery of a handful of gas-rich low-mass stellar systems (see, e.g., Cannon et al. 2015; Bellazzini et al. 2015a,b; Sand et al. 2015a), the most intriguing case probably being Leo P, a low-mass very metal-poor star-forming dwarf galaxy at D ≃ 1.6 Mpc, likely associated with the NGC 3109 group (Giovanelli et al. 2013; Skillman et al. 2013; McQuinn et al. 2015, 2024).
Along this line of research, Xu et al. (2025) recently identified the stellar counterpart of a low-velocity compact H I cloud discovered in the Five-hundred-meter Aperture Spherical radio Telescope (FAST) extragalactic H I survey (Zhang et al. 2024). In spatial coincidence with the H I cloud they found a small bluish galaxy of elongated shape, KK 153 (LEDA 4192). Xu et al. (2025). After carefully analysing all the available data, Xu et al. (2025) conclude that KK 153 has a stellar mass near the threshold adopted to divide ordinary dwarf galaxies and ultra faint dwarf galaxies (UFDs; M★ ≃ 105 M⊙; McQuinn et al. 2024), which suggests that it may be a new member of the rare class of gas-rich UFDs in the Local Group or its immediate vicinity, together with Leo T (D = 0.4 Mpc, Irwin et al. 2007) and Leo P (D = 1.6 Mpc, McQuinn et al. 2015).
However, many of the conclusions drawn by Xu et al. (2025) were based on a highly uncertain distance estimate, based on the baryonic Tully-Fisher relation,  . In our experience, a much more accurate distance measurement for dwarfs in this distance range can be very efficiently obtained with less than half an hour of observation with the Large Binocular Camera (LBC, mounted at the Large Binocular Telescope1; Giallongo et al. 2008) in binocular mode, under sub-arcsec seeing conditions (Bellazzini et al. 2011, 2015a; Annibali et al. 2020; Sacchi et al. 2024), by resolving the outskirts of these galaxies into individual stars to a depth where the tip of the red giant branch (RGB) can be used as a standard candle (see, e.g., Lee et al. 1993; Salaris & Cassisi 1998; Madore & Freedman 2020; Bellazzini & Pascale 2024, and references therein). For this reason we asked to observe KK 153 with LBC under the Italian LBT Director Discretionary Time and we were awarded time under programme DDT-2024B-03.
In this paper we describe the results of this experiment, that lead to a significantly revised and improved measurement of the distance to KK 153. Although our new measurement clearly locates KK 153 beyond the Local Group, which implies a larger stellar mass than that inferred by Xu et al. (2025), KK 153 remains among the least massive local and isolated gas-rich dwarfs, near the mass threshold of systems that were able to avoid complete quenching during the re-ionisation the Universe, a crucial regime to understand the evolution of dwarf galaxies (see, e.g., Gutcke et al. 2022; Xu et al. 2025; Mutlu-Pakdil et al. 2025; McQuinn et al. 2024; Jones et al. 2025, and references therein).
The paper is organised as follows. In Sect. 2 we describe the observations, the data reduction and calibration, the adopted selection, and the colour magnitude diagram (CMD) of KK 153 that we obtained from our data; in Sect. 3 we derive a new distance measurement to KK 153 using the tip of the RGB (TRGB) as a standard candle and we provide new measurements of the integrated magnitudes and estimates of the stellar mass. Finally, in Sect. 4 we summarise and briefly discuss our results. The most relevant properties of KK 153 derived in this paper are summarised in Table 1.
Main properties of KK 153.
2. Observations and data reduction
Observations were carried out with the LBC in binocular mode, by which simultaneous imaging in the Sloan Digital Sky Survey2 (SDSS) g and r bands was obtained. The data were acquired on May 21, 2025 (UT) under clear sky conditions, with an average seeing of 0.9″. The total exposure time per filter was 1800 s, split into six individual 300 s exposures. The images were bias-subtracted, corrected for flat-field, and cleaned of hot and dead pixels as well as for cosmic ray hits with the standard procedure adopted by the INAF LBT-Italia team3 (see, e.g., Annibali et al. 2020, for a detailed description). A portion of an image obtained from the stacking of all the g and r images centred on KK 153 is shown in Fig. 1. A population of bright blue stars broadly clustered in the central regions, along the minor axis, is surrounded by an elongated and more extended halo of fainter and redder stars, which is fully consistent with the findings by Xu et al. (2025).
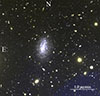 |
Fig. 1. Red-green-blue cut-out image of KK 153 and its immediate surroundings obtained from sky-subtracted, stacked deep g and r images. The r image has been used for both the red and the green channels, while the g image has been used for the blue channel. |
LBC is a mosaic of four adjacent 4608 px × 2048 px Charge Coupling Devices (CCDs), with a pixel scale of 0.225″ px−1 (Giallongo et al. 2008). Each CCD chip covers a field of 17.3′×7.7′. In our images, KK 153 is imaged near the centre of the central chip (Chip 2; slightly offset to minimise the contaminating effect of a few very bright stars in the field). Since the field of view of Chip 2 is wide enough to sample KK 153 and an ample portion of the surrounding field, in the following we limit our analysis to Chip 2 images, as done in Bellazzini et al. (2011) in the study of a similar system.
We performed point spread function (PSF) photometry of individual stars using DAOPHOT II (Stetson 1987). To summarise, 20 to 30 well-sampled, non-saturated and isolated stars were selected in each individual frame to estimate the PSF models. The best PSF models were fit using a Lorentz function. The spatial trends of the PSF shape within the frame were fitted with a second order polynomial in x, y. The PSF fitting was performed on each image using the ALLFRAME routine (Stetson 1994). First we created a master catalogue of sources by selecting the objects with peaks higher than 3σ above the background in a stacked image obtained by registering and co-adding all the images considered for the analysis. Then, ALLFRAMES automatically identified and fitted each of these sources on the individual images. Only sources found at least in three g and three r images were retained in the final catalogue. The average and the standard error of the mean of the independent measurements obtained from the different images were adopted as the final values of the instrumental magnitude and of the uncertainty on the relative photometry.
In wide-field deep stellar photometry, distant background galaxies are the major source of contamination (see Bellazzini et al. 2011, for a detailed discussion in a very similar context and for further references). To mitigate the contamination of our sample by these sources and by other spurious detections we adopted the magnitude-dependent selection on the DAOPHOT II SHARP parameter illustrated in the upper panel of Fig. 24. SHARP should take values as near to zero as the shape of the light distribution is more similar to that expected from a point-like source (PSF), while significant deviations towards positive values indicate extended sources (e.g, galaxies or blended stars) and deviations towards negative values identify sources that are more compact than point sources (e.g., residual small cosmic spikes or hot pixels). The adopted selection should remove a large fraction of contaminating background galaxies, with efficiency decreasing towards fainter magnitudes, as expected.
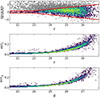 |
Fig. 2. Upper panel: Distribution of the Daophot SHARP shape parameter as a function of r magnitude. Sources that lie in the region enclosed by the red contours are considered as likely stars, while those outside the contours (grey points), mostly distant unresolved galaxies, have been excluded from the subsequent analysis. Middle and lower panels: Distribution of the photometric errors in r and g as a function of r and g magnitude, respectively. |
The middle and lower panels of Fig. 2 show the distribution of photometric errors as a function of the magnitude, in r and g. The photometric error is ≤0.05 mag for g(r)≲25.0(24.0), then it gently increases, reaching ≃0.2 mag at g(r)≃27.0(26.0). To further clean the final catalogue on which we performed the scientific analysis, in addition to the selection in SHARP described above, we rejected all the sources that had errg ≥ 0.2 or errr ≥ 0.2. The distribution in the sky of the finally selected sources is presented in Fig. 3, where in red we plot the sources within R = 2.0′ from the centre of KK 153 (taken from Xu et al. 2025) and in cyan those farther than R = 3.0′, since in the following, these two regions will often serve as reference for the KK 153 “on target” sample and for the control field, respectively. The over-density of sources that correspond to the resolved stars in KK 153 is readily evident at the centre of the red circular region.
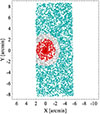 |
Fig. 3. Sky map of the position of the sources in our selected catalogue, in an orthographic projection reference system with the origin at the centre of KK 153. North is up, east to the left. Sources within 2.0′ from the centre of KK 153 are plotted in red (galaxy), sources with R > 3.0′ are plotted in cyan (field). |
2.1. Photometric and astrometric calibrations
We achieved the astrometric and photometric calibrations using sources in common with the SDSS-DR16 dataset (Ahumada et al. 2020). We mapped the astrometry of our raw catalogue into the SDSS-DR16 system with a fourth order polynomial fitted on 112 stars in common, with the appropriate code of the CataPack5 suite. The resulting rms spread is < 0.15″ both in RA and Dec.
We obtained the photometric calibration from the subset of the brightest sources classified as stars in SDSS-DR16, about 50 stars that cover the colour range enclosing the large majority of the stars of scientific interest, 0.0 ≲ g − r ≲ 1.8. We adoptyed a first order polynomial as a function instrumental g − r colour, which is strictly analogous to what was done in Bellazzini et al. (2011, 2015a), and Annibali et al. (2020). In the following, the rms spread about the calibrating relations, 0.073 mag and 0.076 mag in g and r bands, respectively, is added in quadrature to the error budget of all the derived quantities that depend on the absolute photometric calibration.
2.2. Surface photometry
We performed the integrated photometry of the galaxy using the Aperture Photometry Tool (APT; Laher et al. 2012a,b) on our stacked g and r images. After we verified that the axis ratio reported in the Hyperleda6 catalogue (Makarov et al. 2014) and the position angle reported by Xu et al. (2025) are appropriate for KK 153 (see Table 1), we adopted elliptical apertures accordingly shaped and oriented.
To measure the integrated photometry we adopted an aperture with semi-major axis of 180 px = 40.5″, which should enclose most of the KK 153 light. The sky background was computed on a concentric elliptical annulus with inner(outer) semi-major axis of 300 px(350 px), width = 11.25″, wide enough to account for the contribution of background or foreground sources to the surface photometry over such large apertures.
Our integrated magnitudes are ≃0.5 mag brighter than those reported by Xu et al. (2025). No detail on the way in which their integrated magnitudes were obtained is reported in Xu et al. (2025). A possible explanation for the observed difference is that they may have adopted a smaller aperture. With the same aperture used above, we obtain results fully compatible with those from LBC images, within the uncertainties, from photometrically calibrated SDSS images, which supports our measurements. The rationale behind the choice of a large aperture, was the fact that we detect RGB stars attributable to KK 153 at least out to R ≃ 1.5′ from the centre of the galaxy (see below). The finally adopted aperture size is trade-off between the extension of the stellar distribution and the requirement to avoid the inclusion of an excessively extended region where the light from the galaxy is below the sky level.
Finally, we empirically estimated the half-light radius as the semi-major axis of the elliptical aperture containing half of the flux measured in the aperture used for the integrated magnitude. The value reported in Table 1 is the average of the values we got from the g and r images, and the uncertainty is the associated standard deviation.
2.3. Colour magnitude diagram
The CMDs of the sources enclosed within 2.0′ (galaxy) and of those lying farther than 3.0′ from the centre of KK 153 (field) are shown in the left and middle panels of Fig. 4, respectively. The field stars are distributed over a sky area that is more than 8.3 times the area covered by the galaxy sample. All the magnitudes are corrected for foreground extinction adopting Ag = 3.734E(B − V) and Ar = 2.583E(B − V), following Bellazzini & Pascale (2024), and E(B − V) = 0.009 from the Schlegel et al. (1998, SFD98) reddening maps recalibrated according to Schlafly & Finkbeiner (2011, SF10). We used the same maps to verify that the extinction variations are negligible across the considered field of view.
For r0 ≥ 23.5, the CMD of the field is dominated by the wedge-shaped distribution of distant galaxies in the blue sequence, around (g − r)0 ≃ 0.2, while most of the sources redder than (g − r)0 ≃ 1.0, at any magnitude, are likely to be local M dwarfs, and most bluer sources at r0 ≤ 23.5 are Galactic main sequence (MS) stars along the line of sight (Bellazzini et al. 2011). In the R < 2.0″ CMD the blue sequence wedge is still the dominant feature, but a handful of stars bluer than (g − r)0 ≃ 0.0 also emerges, that have no counterpart in the field: these are young stars located in the innermost corona of KK 153 that our observations are able to resolve into stars. An over-density of stars in the colour range 0.8 ≤ (g − r)0 ≤ 1.5 is also apparent, when compared to the field CMD. In an analogy to the cases shown and discussed by Sacchi et al. (2024) in a very similar context, we identify this wide sequence as the upper RGB of KK 153, tipping about r0 ≃ 24.5. In the right panel of Fig. 4 we illustrate how we selected candidate RGB stars of KK 153 in the following analysis.
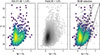 |
Fig. 4. Left panel: CMD of stars enclosed within a circle of radius = 2.0′ centred on the centre of KK 153. Middle panel: CMD of all the stars in our field located at an angular distance larger than = 3.0′ from the centre of KK 153 (field). It is worth noting that the area of the R > 3.0′ field is more than 8.3 times the area of the R < 2.0′ circle around the galaxy. Right panel: CMD of KK 153 superimposed to the CMD of the field population. The two dashed parallel lines display our selection of candidate RGB stars of KK 153. In all the CMDs the colour intensity of the points is proportional to the local star count density (Hess diagram). |
However, given the relatively low number of likely KK 153 stars that we actually resolve, before proceeding to measure the distance, we want to provide additional evidence that we have indeed positively detected the RGB of the galaxy. The comparison between the colour distribution of the galaxy, here defined as the R < 1.5′ circle to maximise the contrast, and field samples in the upper panel of Fig. 5, normalised to their areas, clearly shows that in the galaxy there is a strong excess of stars in the range 1.0 ≤ (g − r)0 ≤ 1.5 with respect to the field. Limiting the comparison to stars fainter than r0 = 23.0, we found that, according to the Kolmogorov-Smirnov test, the probability that the two distributions are drawn from the same parent population is as low as PKS = 1.7 × 10⁻⁷.
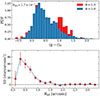 |
Fig. 5. Upper panel: Colour distribution of the stars within 1.5′ from the centre of KK 153 (red histogram) compared to the colour distribution of the field stars (R > 3.0′; blue histogram). Lower panel: Background-subtracted surface density profile of RGB stars (selected as in Fig. 4, with the additional condition r0 > 23.0) from the centre of KK 153. |
Then, selecting the candidate RGB stars as shown in the left panel of Fig. 4, with the additional condition r0 > 23.0, we derived the surface density profile of these stars around the centre of KK 153, along the major axis, using the elliptical radius Rell as defined in Eq. (1) of Perina et al. (2009). The profile, shown in the lower panel of Fig. 5, demonstrates that the stars that we identify as RGB members of KK 153 are highly over-dense around the centre of the galaxy and are distributed along a coherently declining profile, over a scale of 4−5 half light radii7. The difference in the surface density of RGB stars between the R < 1.5(2.0)′ and the R > 3.0′ regions exceeds zero by more than 8.6σ(8.3σ). Hence, there is no doubt that we have resolved the brightest ≃2 mag of the RGB of KK 153.
3. Distance and stellar mass
To measure the magnitude of the RGB Tip of KK 153 we applied the bayesian inference model described in Bellazzini & Pascale (2024) to the colour-selected RGB stars that lie within 2.0′ from the centre of the galaxy. The actual detection is illustrated in Fig. 6, giving  .
.
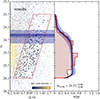 |
Fig. 6. Measurement of the RGB tip following Bellazzini & Pascale (2024). Left panel: CMD zoomed on the RGB of KK 153, with the stars colour coded according to the local star count density. The red polygon displays the selection window of the stars used for the detection of the tip, with the additional constraint R < 2.0′. The horizontal line marks the position of the tip, while the dark purple and light purple bands mark the ±1σ and ±3σ uncertainty regions about the tip. Right panel: Luminosity function of the selected KK 153 RGB stars with the median model (black line) and the ±1σ and ±3σ confidence intervals (dark purple and light purple bands, respectively) superimposed. |
Bellazzini & Pascale (2024) do not provide a calibration of MrTRGB, since the relatively blue r band is not ideal to trace the tip over a large range of metallicity and/or RGB colours. However, here we are dealing with low-mass, metal-poor populations, which is a regime where MrTRGB depends only very weakly on colour (Bellazzini et al. 2011). Moreover, we derive the distance modulus taking as reference the RGB tip of the Small Magellanic Cloud (SMC), which has a mean tip colour similar to KK 153 ((g − r)0TRGB = 1.13, and (g − r)0TRGB = 1.22 for KK 153 and the SMC, respectively). Using the same sample and the same technique as Bellazzini & Pascale (2024), we obtained MrTRGB16.080 ± 0.022 for the SMC. Adopting (m − M)0SMC = 18.997 ± 0.032 from Graczyk et al. (2020), we obtained MrTRGB = −2.917 ± 0.039 for SMC-like RGB populations, which is in reasonable agreement with the value derived by Bellazzini et al. (2011) for (g − r)0TRGB < 1.4 from theoretical models.
If we take the SMC as our distance reference, the distance modulus  is obtained for KK 153, including the uncertainty in the photometric calibration. This corresponds to
  Mpc, with uncertainties reaching
  Mpc if an additional uncertainty of 0.1(0.2) magnitudes for the TRGB calibration in r band is hypothesised.
There is no sound way to estimate the amount of any systematic uncertainty possibly associated to the adopted calibration. As a broad reference we note that a shift of 0.08 mag, for example, is required to match the predictions from the PARSEC (Bressan et al. 2012) models with the adopted measurement of MIETRGB for the SMC and that the scatter of those models at the colour of the SMC due to an age spread of 9 Gyr is < 0.04 mag (Bellazzini & Pascale 2024). The exercise performed here by considering 0.1 mag and 0.2 mag additional uncertainty is meant to show that the 1σ accuracy of our distance measure also remains below ≃10% when an unrealistically large uncertainty on the calibration is assumed.
3.1. Testing distance with stellar models and location in the Local Volume
In Fig. 7 we compare the observed CMD of KK 153 with a set of theoretical isochrones from the PARSEC dataset (Bressan et al. 2012, obtained with the dedicated web tool8) shifted to our newly derived distance (D = 3.06 Mpc, left panel) and to the distance inferred by Xu et al. (2025, D = 2.0 Mpc, right panel). The short distance assumption clearly fails to match the observed RGB. On the other hand, for D = 3.06 Mpc the bundle of isochrones that span the metallicity −2.0 ≤ [M/H] ≤ −1.0 and the age range 5−10 Gyr provides a fully satisfactory fit to the observed RGB. The handful of Main Sequence and Blue Loop stars that we were able to resolve are well matched by [M/H] = −1.0 isochrones of age 40 Myr and 63 Myr, which suggest that the star formation was active until very recent epochs in KK 153, and is possibly still ongoing.
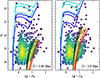 |
Fig. 7. CMD of KK 153 with isochrones superimposed after correction for the distance measured in this paper (D = 3.06 Mpc, left panel) and for the distance estimated by Xu et al. (2025, D = 2.0 Mpc, right panel). The isochrones that display the RGB phase have metallicity [M/H]= − 2.0 (black), [M/H]= − 1.5 (yellow), and [M/H]= − 1.0 (red). For each metallicity, isochrones of two different ages are plotted, 5.0 Gyr and 10.0 Gyr, where in each pair the older isochrone is redder than the younger one. Two age ≤ 100 Myr isochrones with [M/H]= − 1.0 are also superimposed on both CMDs with the aim of fitting the handful of young KK 153 stars included in our sample. The young isochrones in the left panel have an age = 40 Myr (in cyan), and 63 Myr (in blue), and in the right panel age = 63 Myr (in cyan), and 100 Myr (in blue). |
The derived distance locates KK 153 significantly farther away than the estimate by Xu et al. (2025), clearly beyond the boundaries of the Local Group, and reduces the uncertainties from more than 50% to less than 10%. Indeed, Fig. 8 shows that KK 153 is located between the M81 and the CVn I galaxy groups, and, similarly to the other recently discovered gas-rich low-stellar-mass dwarfs discussed in Mutlu-Pakdil et al. (2025), is remarkably isolated. The nearest confirmed galaxy in the Pace (2025, P24 hereafter) catalogue is UGC 8508 at 630 kpc, itself a pretty isolated dwarf.
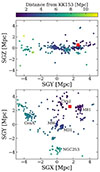 |
Fig. 8. Location of KK 153 in cartesian Supergalactic coordinates. Upper panel: SGY-SGZ projection. Lower panel: SGX-SGY projection. KK 153 is plotted as a large red square while the confirmed dwarfs in the P24 catalogue are plotted as small filled circles colour-coded according to their distance from KK 153. The main galaxy groups are labelled in the lower panel. |
3.2. Stellar mass
The distance modulus derived above was used to convert apparent integrated magnitudes into their absolute counterparts Mg = −10.57 ± 0.15 and Mr = −11.08 ± 0.15. The value MV = −10.87 ± 0.20 was obtained with the photometric transformation
 (1)
(1)
by R. Lupton9. These absolute magnitudes have been converted into total luminosities in the various passbands assuming the absolute magnitudes of the Sun listed by Willmer (2018)10.
To convert luminosities into stellar masses we must refer to relations that provide the stellar mass-to-light (M/L) ratio as a function of the galaxy colour, as done by Xu et al. (2025). To somehow account for the systematic uncertainty inherent to these relations and to the models they are derived from we decided to derive M/Lg and M/Lr from various relations from different authors. In particular we used the equations as a function of (g − r)0 colour by Herrmann et al. (2016), as done by Xu et al. (2025), by Zibetti et al. (2009), and the two sets of relations derived from different models by Roediger & Courteau (2015), for a total of four different M/L estimates per passband. For the colour of KK 153, (g − r)0 = 0.51, we obtain M/Lg(M/Lr) values ranging from 1.04(1.01) to 1.43(1.39), which implies that the uncertainties tied to the adopted M/L are likely to be as large as 40% and possibly larger. We adopt the average of these four values as our reference M/L and their standard deviation as the associated uncertainty, that is M/Lg = 1.18 ± 0.17, and M/Lr = 1.20 ± 0.17.
From these M/L ratios we get M★ = 2.5 ± 0.2 × 10⁶ M⊙ and M★ = 2.1 ± 0.3 × 10⁶ M⊙ from Lg and Lr, respectively. As our final best estimate of the stellar mass of KK 153 we take the weighted average of these two values, M★ = 2.4 ± 0.2 × 10⁶ M⊙. This is more than five times larger than the estimate by Xu et al. (2025,  ), albeit the statistical difference is less than 2σ, due to the very large size of the upper error bar of the Xu et al.’s value. The most important factor contributing to the difference between the two stellar mass estimates is the improved distance (2.35×), then the brighter integrated magnitudes (1.58×), and finally the difference in M/L value, which contributes with a 1.46× factor. The latter difference is due to the bluer colour obtained by Xu et al. (2025), (g − r)0 = 0.4, instead of our (g − r)0 = 0.5. If our hypothesis that Xu et al. (2025) measured the integrated magnitude over an aperture smaller than the one adopted here (Sect. 2.2) is correct, it may also explain the difference in colour, since smaller apertures would progressively remove the contribution of red RGB stars to the integrated colour, as these stars also populate the outskirts of the galaxy (and dominate the stellar mass budget), while young blue stars are the prime contributor of light in the central region but are absent outside (and are expected to provide a minor contribution to the mass budget).
4. Discussion and conclusion
We obtained deep photometry of KK 153, a stellar system recently identified as a local low-stellar-mass gas-rich dwarf galaxy by Xu et al. (2025). Based on a very uncertain distance estimate these authors suggested that KK 153 may be a UFD galaxy at the edge of the Local Group, akin to Leo P (McQuinn et al. 2015). However, our newly derived and much more accurate distance, measured from the RGB tip, relocates the dwarf clearly beyond the Local Group, which also leads to a significantly larger stellar mass estimate, significantly beyond the limit between UDFs and normal dwarfs adopted by Xu et al. (2025), M★ ≃ 105 M⊙. Considering the integrated V luminosity LV, KK 153 is ≃4.5 times brighter than Leo P, and ≃14 times brighter than Leo T (P24). Given the similarity in the stellar content, it can be concluded that KK 153 also exceeds these two galaxies by similar factors in stellar mass.
To properly place KK 153 within the context of local dwarfs, in Fig. 9 we show its position within the rh versus MV and MH I versus MV relations defined by the confirmed dwarf galaxies listed in the P24 catalogue. KK 153 lies on the high surface brightness edge of the luminosity-size relation, as typically done by isolated dwarfs (Mutlu-Pakdil et al. 2025). On the other hand, the lower panel of Fig. 9 shows that it is among the faintest known dwarfs that retain a measurable amount of H I in the P24 list, displaying a MH I/M★ ratio ≃0.5, which is quite typical of dwarf galaxies. In this plot there are eleven dwarfs fainter than KK 153, four of them are more distant than it, three are part of the NGC 3109 group (Antlia and Antlia B at D ≃ 1.3 Mpc, and Leo P, at D ≃ 1.6 Mpc), and the remaining four are genuine Local Group members, the dwarf irregulars LGS 3 and Acquarius, the transition type dwarf Phoenix, and the gas-rich UFD Leo T, which all have D ≤ 1.0 Mpc.
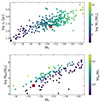 |
Fig. 9. KK 153 in the context of the confirmed dwarf galaxies in the P24 database. Upper panel: MV vs. log rh. Points are colour-coded according to the stellar mass derived from the integrated V luminosity adopting M/LV = 1.0 (while in the original P24 list M/LV = 2.0 is adopted). Lower panel: MV vs. log MH I for the P24 dwarfs that have a valid measurement of the H I mass. The points are colour-coded according to their H I mass to stellar mass ratio. In this case M/LV = 1.0 was adopted as well. In both panels KK 153 is highlighted with a red square. |
In terms of distance, isolation, MV, ellipticity, and size, KK 153 is remarkably similar to the recently discovered Corvus A dwarf (Jones et al. 2024), which, however, is more gas-rich, with MH I/M★ ≃ 2.3 (Mutlu-Pakdil et al. 2025). Both galaxies display a remarkably regular distribution of H I approximately with the same centre as the star distribution (Jones et al. 2024; Xu et al. 2025), in contrast, for example with the cases of other similar isolated dwarfs such as VV 124(UGC 4879) (Bellazzini et al. 2011) or Pavo (Jones et al. 2025). This variety of H I morphologies may suggest that we are observing these galaxies in different phases of their activity, within a cycle that may include star formation, feedback, gas ejection, gas recovery and resettlement to an equilibrium configuration (see, e.g., Rey et al. 2022, 2024; Gutcke et al. 2022; McQuinn et al. 2024; Jones et al. 2025, and references therein).
In a study aimed at exploring the threshold between galaxies quenched by re-ionisation and survivors that were able to form stars after that phase, Gutcke et al. (2022) performed detailed very high-resolution simulations of five haloes in a stellar mass range (at z = 0) enclosing KK 153, 0.22 × 10⁶ M⊙ ≤ M★ ≤ 9.42 × 10⁶ M⊙. They found that, while the onset of re-ionisation heavily impacted the star formation of all the considered haloes, three of them were able to re-ignite the star formation after a period of quiescence, albeit at a much lower rate than before. One of these survivors, their ‘HaloD’, displays z = 0 observable properties that are remarkably similar to KK 153 (M★ = 1.6 × 10⁶ M⊙, rh = 120 pc, ongoing star formation). It is intriguing to note that one of the Gutcke et al. (2022) haloes that was permanently quenched by re-ionisation, ‘HaloC’, has both a slightly larger halo mass and stellar mass than ‘HaloD’, which highlights the delicate interplay of the various factors at play in determining the actual destiny of such small galaxies, not simply total mass (see also McQuinn et al. 2024, for further discussion and references). The study of systems like KK 153 may help us to gain insight into this crucial phase in the evolution of dwarf galaxies, and they have deservedly been a subject of intense research in the last decade (see, e.g., Cannon et al. 2011, 2015; McQuinn et al. 2015, 2024; Sand et al. 2015b; Hirschauer et al. 2016; Mutlu-Pakdil et al. 2025; Jones et al. 2025, and references therein).
Acknowledgments
The authors thank an anonymous referee for a constructive and useful report. MB, FA and DPM acknowledge financial support to this project by INAF, through the PRIN-2023 grant Ob. Fu 1.05.23.05.09 “Dwarf galaxies as probes of the Lambda Cold Dark Matter hierarchical paradigm at the smallest scales” (P.I.: F. Annibali). This paper is supported by the Italian Research Center on High Performance Computing Big Data and Quantum Computing (ICSC), project funded by European Union – NextGenerationEU – and National Recovery and Resilience Plan (NRRP) – Mission 4 Component 2 within the activities of Spoke 3 (Astrophysics and Cosmos Observations). RP acknowledges the support to this study by the PRIN INAF Mini Grant 2022 (Ob.Fu. 1.05.12.04.02 – CUP C33C22000970005). FA acknowledges support by the PRIN INAF Mini Grant 2024 (Ob.Fu.1.05.24.07.02 – CUP C33C24001360005). This work is based on LBT data. The LBT is an international collaboration among institutions in the United States, Italy, and Germany. LBT Corporation partners are the University of Arizona on behalf of the Arizona Board of Regents; Istituto Nazionale di Astrofisica, Italy; LBT Beteiligungsgesellschaft, Germany, representing the Max Planck Society, the Leibniz Institute for Astrophysics Potsdam, and Heidelberg University; the Ohio State University, and the Research Corporation, on behalf of the University of Notre Dame, University of Minnesota, and University of Virginia. We acknowledge the support from the LBT-Italian Coordination Facility for the execution of observations, data distribution, and reduction. This work made use of SDSS-V data. Funding for the Sloan Digital Sky Survey V has been provided by the Alfred P. Sloan Foundation, the Heising-Simons Foundation, the National Science Foundation, and the Participating Institutions. SDSS acknowledges support and resources from the centre for High-Performance Computing at the University of Utah. SDSS telescopes are located at Apache Point Observatory, funded by the Astrophysical Research Consortium and operated by New Mexico State University, and at Las Campanas Observatory, operated by the Carnegie Institution for Science. The SDSS web site is www.sdss.org. SDSS is managed by the Astrophysical Research Consortium for the Participating Institutions of the SDSS Collaboration, including the Carnegie Institution for Science, Chilean National Time Allocation Committee (CNTAC) ratified researchers, Caltech, the Gotham Participation Group, Harvard University, Heidelberg University, The Flatiron Institute, The Johns Hopkins University, L’Ecole polytechnique fédérale de Lausanne (EPFL), Leibniz-Institut für Astrophysik Potsdam (AIP), Max-Planck-Institut für Astronomie (MPIA Heidelberg), Max-Planck-Institut für Extraterrestrische Physik (MPE), Nanjing University, National Astronomical Observatories of China (NAOC), New Mexico State University, The Ohio State University, Pennsylvania State University, Smithsonian Astrophysical Observatory, Space Telescope Science Institute (STScI), the Stellar Astrophysics Participation Group, Universidad Nacional Autónoma de México, University of Arizona, University of Colorado Boulder, University of Illinois at Urbana-Champaign, University of Toronto, University of Utah, University of Virginia, Yale University, and Yunnan University. This research has made use of the SIMBAD database, operated at CDS, Strasbourg, France. This research has made use of the NASA/IPAC Extragalactic Database (NED), which is operated by the Jet Propulsion Laboratory, California Institute of Technology, under contract with the National Aeronautics and Space Administration. We acknowledge the usage of the HyperLeda database (http://leda.univ-lyon1.fr). In this analysis we made use of TOPCAT (http://www.starlink.ac.uk/topcat/, Taylor 2005), APT (https://www.aperturephotometry.org, Laher et al. 2012a,b), DAOPHOT II ALLFRAME (Stetson 1987, 1994), Sextractor (Bertin & Arnouts 1996), numpy, astropy, scipy, matplotlib.
References
- Adams, E. A. K., Giovanelli, R., & Haynes, M. P. 2013, ApJ, 768, 77 [NASA ADS] [CrossRef] [Google Scholar]
- Ahumada, R., Allende Prieto, C., Almeida, A., et al. 2020, ApJS, 249, 3 [NASA ADS] [CrossRef] [Google Scholar]
- Anand, G. S., Benítez-Llambay, A., Beaton, R., et al. 2025, ApJ, 993, L55 [Google Scholar]
- Annibali, F., Beccari, G., Bellazzini, M., et al. 2020, MNRAS, 491, 5101 [NASA ADS] [Google Scholar]
- Bellazzini, M., & Pascale, R. 2024, A&A, 691, A42 [NASA ADS] [CrossRef] [EDP Sciences] [Google Scholar]
- Bellazzini, M., Perina, S., Galleti, S., & Oosterloo, T. 2011, A&A, 533, A37 [NASA ADS] [CrossRef] [EDP Sciences] [Google Scholar]
- Bellazzini, M., Beccari, G., Battaglia, G., et al. 2015a, A&A, 575, A126 [NASA ADS] [CrossRef] [EDP Sciences] [Google Scholar]
- Bellazzini, M., Magrini, L., Mucciarelli, A., et al. 2015b, ApJ, 800, L15 [NASA ADS] [CrossRef] [Google Scholar]
- Belokurov, V. 2013, New Astron. Rev., 57, 100 [CrossRef] [Google Scholar]
- Bertin, E., & Arnouts, S. 1996, A&AS, 117, 393 [NASA ADS] [CrossRef] [EDP Sciences] [Google Scholar]
- Bressan, A., Marigo, P., Girardi, L., et al. 2012, MNRAS, 427, 127 [NASA ADS] [CrossRef] [Google Scholar]
- Cannon, J. M., Giovanelli, R., Haynes, M. P., et al. 2011, ApJ, 739, L22 [NASA ADS] [CrossRef] [Google Scholar]
- Cannon, J. M., Martinkus, C. P., Leisman, L., et al. 2015, AJ, 149, 72 [NASA ADS] [CrossRef] [Google Scholar]
- Giallongo, E., Ragazzoni, R., Grazian, A., et al. 2008, A&A, 482, 349 [NASA ADS] [CrossRef] [EDP Sciences] [Google Scholar]
- Giovanelli, R., & Haynes, M. P. 2015, A&ARv, 24, 1 [Google Scholar]
- Giovanelli, R., Haynes, M. P., Adams, E. A. K., et al. 2013, AJ, 146, 15 [NASA ADS] [CrossRef] [Google Scholar]
- Graczyk, D., Pietrzyński, G., Thompson, I. B., et al. 2020, ApJ, 904, 13 [Google Scholar]
- Gutcke, T. A., Pfrommer, C., Bryan, G. L., et al. 2022, ApJ, 941, 120 [NASA ADS] [CrossRef] [Google Scholar]
- Herrmann, K. A., Hunter, D. A., Zhang, H.-X., & Elmegreen, B. G. 2016, AJ, 152, 177 [NASA ADS] [CrossRef] [Google Scholar]
- Hirschauer, A. S., Salzer, J. J., Skillman, E. D., et al. 2016, ApJ, 822, 108 [NASA ADS] [CrossRef] [Google Scholar]
- Irwin, M. J., Belokurov, V., Evans, N. W., et al. 2007, ApJ, 656, L13 [NASA ADS] [CrossRef] [Google Scholar]
- Jones, M. G., Mutlu-Pakdil, B., Sand, D. J., et al. 2023, ApJ, 957, L5 [Google Scholar]
- Jones, M. G., Sand, D. J., Mutlu-Pakdil, B., et al. 2024, ApJ, 971, L37 [Google Scholar]
- Jones, M. G., Rey, M. P., Sand, D. J., et al. 2025, ApJ, 990, 164 [Google Scholar]
- Laher, R. R., Gorjian, V., Rebull, L. M., et al. 2012a, PASP, 124, 737 [NASA ADS] [CrossRef] [Google Scholar]
- Laher, R. R., Rebull, L. M., Gorjian, V., et al. 2012b, PASP, 124, 764 [NASA ADS] [CrossRef] [Google Scholar]
- Lee, M. G., Freedman, W. L., & Madore, B. F. 1993, ApJ, 417, 553 [Google Scholar]
- Leisman, L., Haynes, M. P., Janowiecki, S., et al. 2017, ApJ, 842, 133 [NASA ADS] [CrossRef] [Google Scholar]
- Leisman, L., Rhode, K. L., Ball, C., et al. 2021, AJ, 162, 274 [NASA ADS] [CrossRef] [Google Scholar]
- Madore, B. F., & Freedman, W. L. 2020, AJ, 160, 170 [NASA ADS] [CrossRef] [Google Scholar]
- Makarov, D., Prugniel, P., Terekhova, N., Courtois, H., & Vauglin, I. 2014, A&A, 570, A13 [NASA ADS] [CrossRef] [EDP Sciences] [Google Scholar]
- McQuinn, K. B. W., Skillman, E. D., Dolphin, A., et al. 2015, ApJ, 812, 158 [NASA ADS] [CrossRef] [Google Scholar]
- McQuinn, K. B. W., Newman, M. J. B., Skillman, E. D., et al. 2024, ApJ, 976, 60 [Google Scholar]
- Mutlu-Pakdil, B., Jones, M. G., Sand, D. J., et al. 2025, ArXiv e-prints [arXiv:2509.16307] [Google Scholar]
- Pace, A. B. 2025, Open J. Astrophys., 8, 142 [Google Scholar]
- Perina, S., Barmby, P., Beasley, M. A., et al. 2009, A&A, 494, 933 [NASA ADS] [CrossRef] [EDP Sciences] [Google Scholar]
- Rey, M. P., Pontzen, A., Agertz, O., et al. 2022, MNRAS, 511, 5672 [Google Scholar]
- Rey, M. P., Orkney, M. D. A., Read, J. I., et al. 2024, MNRAS, 529, 2379 [NASA ADS] [CrossRef] [Google Scholar]
- Roediger, J. C., & Courteau, S. 2015, MNRAS, 452, 3209 [NASA ADS] [CrossRef] [Google Scholar]
- Sacchi, E., Bellazzini, M., Annibali, F., et al. 2024, A&A, 691, A65 [NASA ADS] [CrossRef] [EDP Sciences] [Google Scholar]
- Salaris, M., & Cassisi, S. 1998, MNRAS, 298, 166 [NASA ADS] [CrossRef] [Google Scholar]
- Sand, D. J., Crnojević, D., Bennet, P., et al. 2015a, ApJ, 806, 95 [Google Scholar]
- Sand, D. J., Spekkens, K., Crnojević, D., et al. 2015b, ApJ, 812, L13 [NASA ADS] [CrossRef] [Google Scholar]
- Saul, D. R., Peek, J. E. G., & Putman, M. E. 2014, MNRAS, 441, 2266 [Google Scholar]
- Schlafly, E. F., & Finkbeiner, D. P. 2011, ApJ, 737, 103 [Google Scholar]
- Schlegel, D. J., Finkbeiner, D. P., & Davis, M. 1998, ApJ, 500, 525 [Google Scholar]
- Simon, J. D. 2019, ARA&A, 57, 375 [NASA ADS] [CrossRef] [Google Scholar]
- Skillman, E. D., Salzer, J. J., Berg, D. A., et al. 2013, AJ, 146, 3 [CrossRef] [Google Scholar]
- Stetson, P. B. 1987, PASP, 99, 191 [Google Scholar]
- Stetson, P. B. 1994, PASP, 106, 250 [Google Scholar]
- Taylor, M. B. 2005, ASP Conf. Ser., 347, 29 [Google Scholar]
- Willmer, C. N. A. 2018, ApJS, 236, 47 [Google Scholar]
- Xu, J.-L., Zhu, M., Yu, N.-P., et al. 2025, ApJ, 982, L36 [Google Scholar]
- Zhang, C.-P., Zhu, M., Jiang, P., et al. 2024, Sci. China Phys. Mech. Astron., 67, 219511 [NASA ADS] [CrossRef] [Google Scholar]
- Zibetti, S., Charlot, S., & Rix, H.-W. 2009, MNRAS, 400, 1181 [NASA ADS] [CrossRef] [Google Scholar]
LBT; https://www.lbto.org
In particular we retain all the sources that have r ≦ 23.0 and |SHARP|< 0.3, or r > 23.0 and |SHARP|< 0.44r − 9.82. The selection window has been drawn by eye to reject most of the obvious outliers of the distribution of SHARP as a function of magnitude, with particular care for the rejection of marginally extended objects.
The drop of the surface density in the innermost point is due to the strong incompleteness affecting the central, overcrowded regions of the galaxy in our images.
All Tables
All Figures
|
Fig. 1. Red-green-blue cut-out image of KK 153 and its immediate surroundings obtained from sky-subtracted, stacked deep g and r images. The r image has been used for both the red and the green channels, while the g image has been used for the blue channel. |
| In the text | |
|
Fig. 2. Upper panel: Distribution of the Daophot SHARP shape parameter as a function of r magnitude. Sources that lie in the region enclosed by the red contours are considered as likely stars, while those outside the contours (grey points), mostly distant unresolved galaxies, have been excluded from the subsequent analysis. Middle and lower panels: Distribution of the photometric errors in r and g as a function of r and g magnitude, respectively. |
| In the text | |
|
Fig. 3. Sky map of the position of the sources in our selected catalogue, in an orthographic projection reference system with the origin at the centre of KK 153. North is up, east to the left. Sources within 2.0′ from the centre of KK 153 are plotted in red (galaxy), sources with R > 3.0′ are plotted in cyan (field). |
| In the text | |
|
Fig. 4. Left panel: CMD of stars enclosed within a circle of radius = 2.0′ centred on the centre of KK 153. Middle panel: CMD of all the stars in our field located at an angular distance larger than = 3.0′ from the centre of KK 153 (field). It is worth noting that the area of the R > 3.0′ field is more than 8.3 times the area of the R < 2.0′ circle around the galaxy. Right panel: CMD of KK 153 superimposed to the CMD of the field population. The two dashed parallel lines display our selection of candidate RGB stars of KK 153. In all the CMDs the colour intensity of the points is proportional to the local star count density (Hess diagram). |
| In the text | |
|
Fig. 5. Upper panel: Colour distribution of the stars within 1.5′ from the centre of KK 153 (red histogram) compared to the colour distribution of the field stars (R > 3.0′; blue histogram). Lower panel: Background-subtracted surface density profile of RGB stars (selected as in Fig. 4, with the additional condition r0 > 23.0) from the centre of KK 153. |
| In the text | |
|
Fig. 6. Measurement of the RGB tip following Bellazzini & Pascale (2024). Left panel: CMD zoomed on the RGB of KK 153, with the stars colour coded according to the local star count density. The red polygon displays the selection window of the stars used for the detection of the tip, with the additional constraint R < 2.0′. The horizontal line marks the position of the tip, while the dark purple and light purple bands mark the ±1σ and ±3σ uncertainty regions about the tip. Right panel: Luminosity function of the selected KK 153 RGB stars with the median model (black line) and the ±1σ and ±3σ confidence intervals (dark purple and light purple bands, respectively) superimposed. |
| In the text | |
|
Fig. 7. CMD of KK 153 with isochrones superimposed after correction for the distance measured in this paper (D = 3.06 Mpc, left panel) and for the distance estimated by Xu et al. (2025, D = 2.0 Mpc, right panel). The isochrones that display the RGB phase have metallicity [M/H]= − 2.0 (black), [M/H]= − 1.5 (yellow), and [M/H]= − 1.0 (red). For each metallicity, isochrones of two different ages are plotted, 5.0 Gyr and 10.0 Gyr, where in each pair the older isochrone is redder than the younger one. Two age ≤ 100 Myr isochrones with [M/H]= − 1.0 are also superimposed on both CMDs with the aim of fitting the handful of young KK 153 stars included in our sample. The young isochrones in the left panel have an age = 40 Myr (in cyan), and 63 Myr (in blue), and in the right panel age = 63 Myr (in cyan), and 100 Myr (in blue). |
| In the text | |
|
Fig. 8. Location of KK 153 in cartesian Supergalactic coordinates. Upper panel: SGY-SGZ projection. Lower panel: SGX-SGY projection. KK 153 is plotted as a large red square while the confirmed dwarfs in the P24 catalogue are plotted as small filled circles colour-coded according to their distance from KK 153. The main galaxy groups are labelled in the lower panel. |
| In the text | |
|
Fig. 9. KK 153 in the context of the confirmed dwarf galaxies in the P24 database. Upper panel: MV vs. log rh. Points are colour-coded according to the stellar mass derived from the integrated V luminosity adopting M/LV = 1.0 (while in the original P24 list M/LV = 2.0 is adopted). Lower panel: MV vs. log MH I for the P24 dwarfs that have a valid measurement of the H I mass. The points are colour-coded according to their H I mass to stellar mass ratio. In this case M/LV = 1.0 was adopted as well. In both panels KK 153 is highlighted with a red square. |
| In the text | |
Current usage metrics show cumulative count of Article Views (full-text article views including HTML views, PDF and ePub downloads, according to the available data) and Abstracts Views on Vision4Press platform.
Data correspond to usage on the plateform after 2015. The current usage metrics is available 48-96 hours after online publication and is updated daily on week days.
Initial download of the metrics may take a while.