Fig. 5.
Download original image
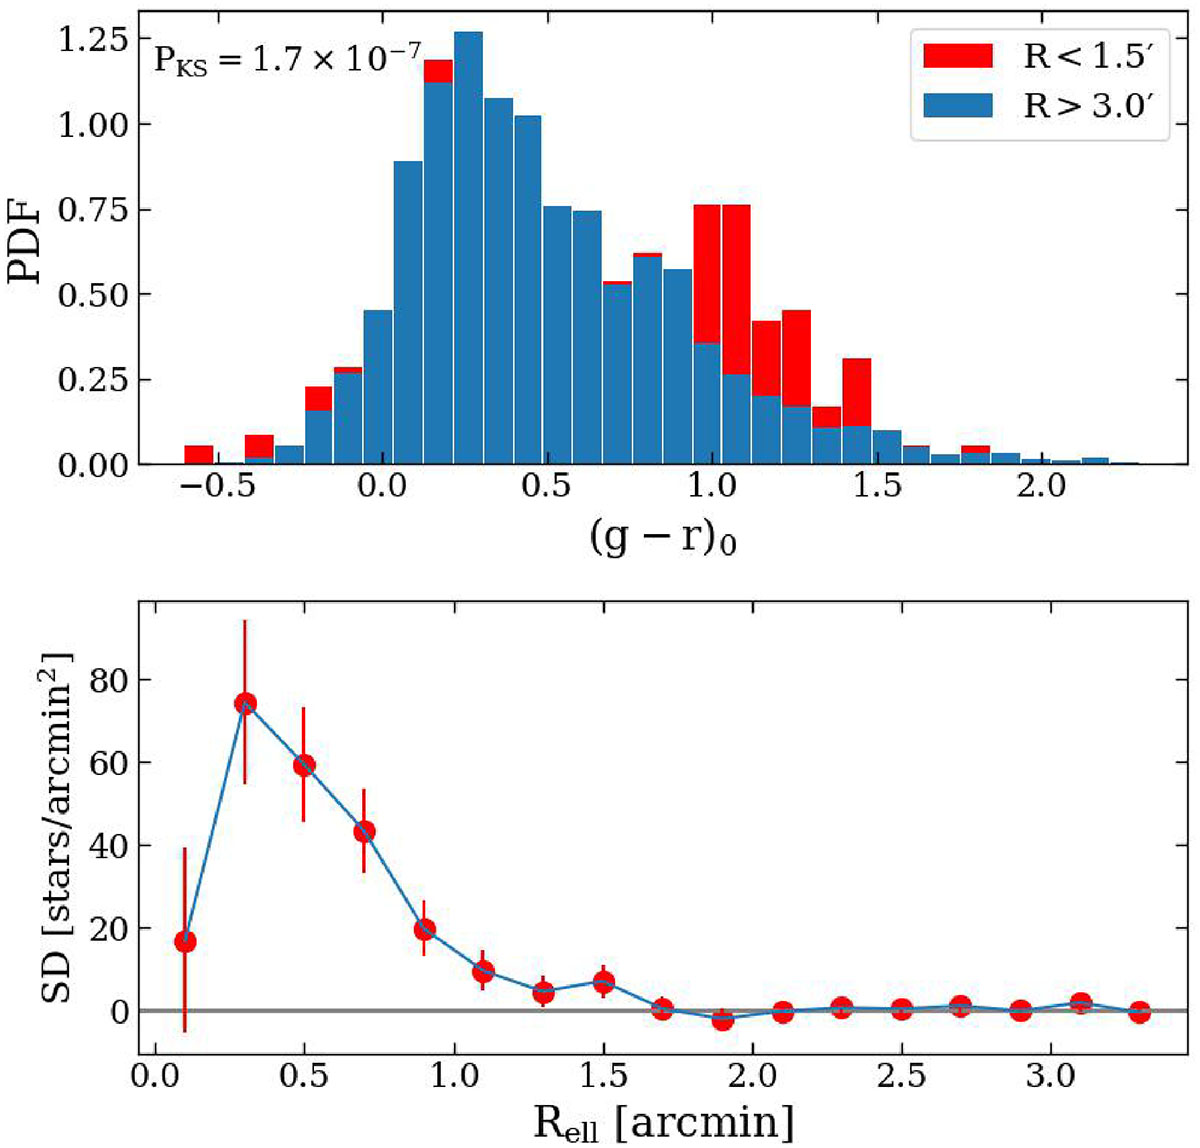
Upper panel: Colour distribution of the stars within 1.5′ from the centre of KK 153 (red histogram) compared to the colour distribution of the field stars (R > 3.0′; blue histogram). Lower panel: Background-subtracted surface density profile of RGB stars (selected as in Fig. 4, with the additional condition r0 > 23.0) from the centre of KK 153.
Current usage metrics show cumulative count of Article Views (full-text article views including HTML views, PDF and ePub downloads, according to the available data) and Abstracts Views on Vision4Press platform.
Data correspond to usage on the plateform after 2015. The current usage metrics is available 48-96 hours after online publication and is updated daily on week days.
Initial download of the metrics may take a while.