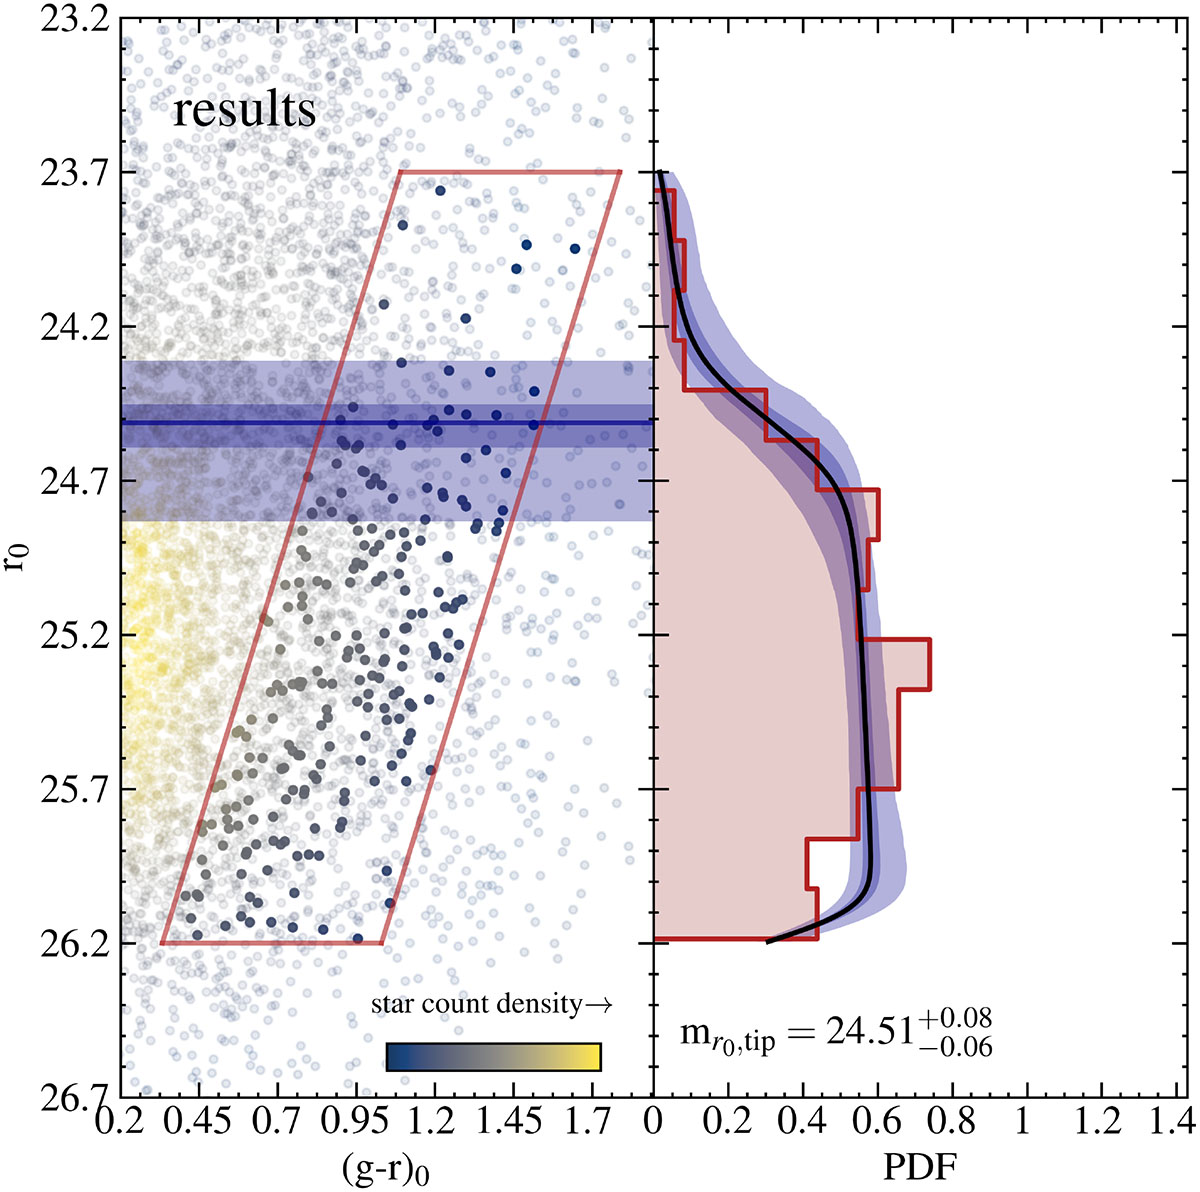
Fig. 6.
Download original image
Measurement of the RGB tip following Bellazzini & Pascale (2024). Left panel: CMD zoomed on the RGB of KK 153, with the stars colour coded according to the local star count density. The red polygon displays the selection window of the stars used for the detection of the tip, with the additional constraint R < 2.0′. The horizontal line marks the position of the tip, while the dark purple and light purple bands mark the ±1σ and ±3σ uncertainty regions about the tip. Right panel: Luminosity function of the selected KK 153 RGB stars with the median model (black line) and the ±1σ and ±3σ confidence intervals (dark purple and light purple bands, respectively) superimposed.
Current usage metrics show cumulative count of Article Views (full-text article views including HTML views, PDF and ePub downloads, according to the available data) and Abstracts Views on Vision4Press platform.
Data correspond to usage on the plateform after 2015. The current usage metrics is available 48-96 hours after online publication and is updated daily on week days.
Initial download of the metrics may take a while.