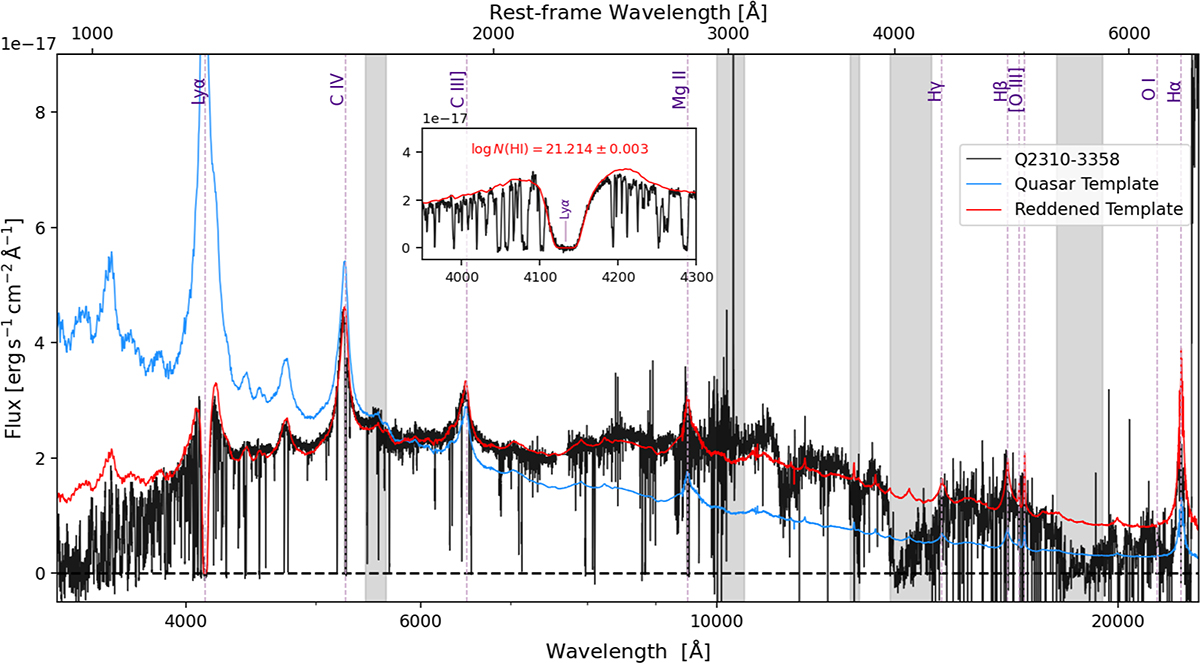
Fig. 1.
Download original image
Spectrum of Q 2310-3358 obtained with VLT/X-Shooter (black curve), with the positions of the prominent quasar emission lines indicated by dashed purple lines. The blue curve represents the composite quasar spectrum from Selsing et al. (2016). A reddened template is plotted in red using the best-fit extinction parameters, along with the addition of a Lyα absorption line corresponding to log N(H I) = 21.21 ± 0.003. The inset provides a zoomed-in view of the Lyα line from the absorber. Gray bands mark the regions where the spectrum is unreliable due to X-Shooter arm overlaps and telluric absorption.
Current usage metrics show cumulative count of Article Views (full-text article views including HTML views, PDF and ePub downloads, according to the available data) and Abstracts Views on Vision4Press platform.
Data correspond to usage on the plateform after 2015. The current usage metrics is available 48-96 hours after online publication and is updated daily on week days.
Initial download of the metrics may take a while.