| Issue |
A&A
Volume 705, January 2026
|
|
|---|---|---|
| Article Number | A123 | |
| Number of page(s) | 8 | |
| Section | Extragalactic astronomy | |
| DOI | https://doi.org/10.1051/0004-6361/202557874 | |
| Published online | 13 January 2026 | |
On the dusty proximate damped Lyman-α system toward Q 2310−3358 at z = 2.40
1
Cosmic Dawn Center (DAWN) Copenhagen 2200, Denmark
2
Niels Bohr Institute, University of Copenhagen Jagtvej 155 2200 Copenhagen N, Denmark
3
French-Chilean Laboratory for Astronomy, IRL 3386, CNRS and U. de Chile Casilla 36-D Santiago, Chile
4
Centre de Recherche Astrophysique de Lyon, Université de Lyon 1, UMR5574 69230 Saint-Genis-Laval, France
5
European Southern Observatory, Alonso de Córdova 3107, Vitacura Casilla 19001 Santiago, Chile
6
Instituto de Astrofísica de Canarias, Vía Láctea s/n 38205 La Laguna Tenerife, Spain
7
Gran Telescopio Canaias (GRANTECAN) 38205 San Cristóbal de La Laguna Tenerife, Spain
★ Corresponding author: This email address is being protected from spambots. You need JavaScript enabled to view it.
Received:
28
October
2025
Accepted:
27
November
2025
Abstract
Quasar absorption systems not only affect the way quasars are selected, but also serve as key probes of galaxies, providing insight into their chemical evolution and interstellar medium (ISM). Recently, a method based on Gaia astrometric measurements has aided the selection of quasars reddened by dust hitherto overlooked. We conducted a spectroscopic study using VLT/X-Shooter on one such dust-reddened quasar, Q 2310–3358. This quasar, at z = 2.3909 ± 0.0022, is associated with a damped Lyman-α absorber (DLA) at nearly the same redshift 2.4007 ± 0.0003, with a neutral hydrogen column density of log N(H I) = 21.214 ± 0.003. The DLA is very metal-rich (close to solar metallicity after correction for depletion on dust grains). Its properties align with the metal-to-dust ratio and the mass-metallicity relation established in previous large samples of DLAs. Surprisingly, given its proximity to the quasar in redshift, the absorber has strong cold gas characteristics, including C I and H2. Based on the derived kinetic temperature of 71−15+28 K, we infer the presence of a strong UV radiation field, which in turn suggests that the quasar and the DLA are in close proximity, i.e., part of the same galaxy and not just different objects in the same overdensity of galaxies. We used the line ratios of the C I fine-structure lines to constrain the density of the cold gas, yielding nH ∼ 103 cm−3. Our analysis extends the understanding of zabs ≈ zem absorption line systems and provides valuable constraints on the interplay between dust, metals, and neutral gas in the ISM of early galaxies.
Key words: dust / extinction / ISM: molecules / quasars: absorption lines / quasars: general / quasars: individual: Q2310–3358
© The Authors 2026
 Open Access article, published by EDP Sciences, under the terms of the Creative Commons Attribution License (https://creativecommons.org/licenses/by/4.0), which permits unrestricted use, distribution, and reproduction in any medium, provided the original work is properly cited.
This article is published in open access under the Subscribe to Open model. This email address is being protected from spambots. You need JavaScript enabled to view it. to support open access publication.
1. Introduction
Ever since their discovery, quasi-stellar objects (quasars) have served as key probes for investigating a range of important aspects of the distant universe (Schmidt 1963; Greenstein & Schmidt 1964). The selection of complete samples of quasars from survey data, therefore, has long been a critical issue to avoid biases. Photometric selection criteria, due to their efficiency and relative accuracy, have been widely used and continuously improved (Sandage et al. 1965; Warren et al. 2000; Stern et al. 2012).
In particular, dust-obscured quasars are both fainter and reddened, resulting in a dust bias that makes them more difficult to identify through photometric selection than unobscured quasars (Fall & Pei 1989; Pei et al. 1991; Pontzen & Pettini 2009; Krogager et al. 2019). The dust causing the extinction is located in a range of different locations, either close to the central black hole, further out in the interstellar medium (ISM) of the host galaxy, in intervening galaxies, or in the Milky Way disk. Dust in the host galaxy or in intervening galaxies will typically be associated with strong hydrogen absorption line systems. When the neutral hydrogen column density of the absorber is sufficiently high (higher than 1020.3 cm−2), these absorbers are called damped Lyα systems (DLAs). Damped Lyα systems can contain substantial amounts of dust and exhibit high metal abundance, therefore playing a crucial role in the study of chemical evolution and the ISM of galaxies (Wolfe et al. 1986; Pettini & Hunstead 1990). New selection methods have been proposed, with the aim of finding quasars missed by more biased selection methods, with several successful advances reported (e.g., Webster et al. 1995; Glikman et al. 2013; Krogager et al. 2016a,b; Heintz et al. 2018b; Glikman et al. 2018, 2022).
In addition to photometry, an innovative method for selecting more complete samples of quasars has been proposed. This approach combines Gaia astrometric measurements with photometric selection criteria in the optical and in the near-infrared, facilitating the construction of a more complete quasar sample (Heintz et al. 2015, 2018a, 2020; Geier et al. 2019). Using this approach, we selected a quasar associated with an absorber at the same redshift. Such systems, so-called proximate systems, are relatively rare among all DLAs (Weymann et al. 1977; Møller et al. 1998; Ellison et al. 2010). In cases where the DLA lies in close proximity to the quasar, the detection of molecules has been considered of particular interest (Srianand & Petitjean 1998; Noterdaeme et al. 2019; Balashev et al. 2020, 2025).
In this paper, we study a dust-obscured quasar, in which a DLA has been detected at nearly the same redshift as the quasar. We observed this DLA using X-Shooter on the Very Large Telescope (VLT) and performed a spectroscopic analysis. In Sect. 2, a new spectroscopic observation of Q 2310−3358 at z = 2.40 is presented, showing prominent features associated with a Lyman-α absorber. In Sect. 3, we show the results of this DLA, including absorption lines, extinction, metallicity, and molecules. In Sect. 4, we present our discussion and conclusions.
2. Observations and data reduction
The quasar Q 2310–3358, located at right ascension (RA) 23:10:15.2 and declination (Dec) −33:58:10.2 (J2000), was identified using a standard photometric selection criterion in combination with a novel Gaia-based astrometric method. In the quasar catalog, we used a selection criteria similar to that of Geier et al. (2019). First, in terms of astrometry, we considered total proper motions μ consistent with zero within 2σ (Heintz et al. 2018a). In terms of photometry, we selected sources with u − g > 1 and r − z > 0.5 (Heintz et al. 2018b). The photometric data for Q 2310–3358 were obtained from several large-scale surveys, including the Kilo Degree Survey (KiDS; de Jong et al. 2013), the VISTA Kilo-degree Infrared Galaxy survey (VIKING; Edge et al. 2013), and the Wide-field Infrared Survey Explorer (WISE; Wright et al. 2010). These datasets provide broad wavelength coverage from the optical to the near-infrared. The magnitudes in each band are listed in Table 1. This source exhibits colors of u − g = 2.151, g − r = 0.744, r − z = 0.35, and J − K = 1.50.
Photometry of Q 2310–3358.
We here present observations of Q 2310–3358 obtained with the medium-resolution spectrograph X-shooter on board VLT. The quasar was observed at three different position angles (0, 60o, and −60o East of North). According to Fynbo et al. (2010), with this strategy, 90% of the galaxy counterparts of intervening DLAs at redshifts around 2–3 can be covered by at least one slit, and observations with all slits also contribute to a good spectrum of the quasar.
X-shooter provides continuous spectral coverage from near-ultraviolet (300 nm) to near-infrared (2500 nm). Both 1D and 2D spectra are available from the standard ESO pipeline reduction of the raw data (Modigliani et al. 2010). For each arm of the data, the spectra from all three position angles were combined using inverse-variance weighting to produce the combined spectrum shown in Fig. 1. The instrument acts as an atmospheric dispersion corrector, meaning that this strategy can also be used well away from the zenith. The log of observations can be seen in Table 2.
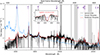 |
Fig. 1. Spectrum of Q 2310-3358 obtained with VLT/X-Shooter (black curve), with the positions of the prominent quasar emission lines indicated by dashed purple lines. The blue curve represents the composite quasar spectrum from Selsing et al. (2016). A reddened template is plotted in red using the best-fit extinction parameters, along with the addition of a Lyα absorption line corresponding to log N(H I) = 21.21 ± 0.003. The inset provides a zoomed-in view of the Lyα line from the absorber. Gray bands mark the regions where the spectrum is unreliable due to X-Shooter arm overlaps and telluric absorption. |
Log of observations.
3. Results
3.1. Emission and absorption lines
We first aim to determine the systemic redshift of the quasar. As shown in Fig. 1, we can easily identify the Si IV, C IV, and C III] emission lines in the X-shooter spectrum. However, these high ionization broad emission lines are known to be blueshifted (Tytler & Fan 1992; Shen et al. 2016), which means that these lines underestimate the systemic redshift of the host galaxy. Given that we cannot clearly see any of the narrow emission lines, such as the [O II] and [O III] lines, nor the strong stellar absorption line Ca IIλ3934 (K), which are the most accurate redshift tracers according to Hewett & Wild (2010) and Shen et al. (2016), we need to rely on the low ionization broad emission lines.
Redshifts determined from low ionization broad emission lines are also found to be quite close to the systemic redshift (Hewett & Wild 2010; Shen et al. 2016). Mg II, Hβ, and [O III] lines are heavily embedded in the telluric lines and sky subtraction residuals in our spectra, while the Hα line is detected at the end of the spectrum in the K band. We determined the systemic redshift of this quasar based on this Hα line. A linear continuum was fit only based on the spectrum at wavelengths shorter than the Hα line and subtracted from the spectrum. Though a combination of several Gaussian functions are often applied to fit the emission lines, such as in Shen et al. (2016), we found that one single Gaussian fit reproduced the Hα line profile quite well. The fitting result is shown in Fig. 2. To account for the systematic effects of artifacts and to obtain a realistic error bar, we performed the fitting both with and without applying the artifact mask. The resulting fits yield the Hα line peak at 22 260 ± 2 Å and 22 275 ± 2 Å, corresponding to quasar redshifts of 2.3909 ± 0.0003 and 2.3931 ± 0.0003, respectively. For the final measurement, we adopted zHα = 2.3909. The statistical uncertainty is 0.0003, while the systematic uncertainty (defined as the difference between the two fits) is 0.0022. Therefore, the total uncertainty is  .
.
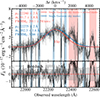 |
Fig. 2. Upper panel: Two single-Gaussian profiles fit to the Hα emission line. The red curve shows the fit after masking the artifacts (marked by the red bands), while the blue curve displays the result when the artifacts are not masked. Bottom: Fitting residuals, where the gray shading denotes the 1σ uncertainty of the spectrum. In both cases, the sky-line regions are masked out, as indicated by the blue bands. The mean (μG), standard deviation (σG), and FWHMG (corrected for the instrument resolution of 39.377 km s−1) of the fit are listed in the plot. |
Dix et al. (2020) offer a method to correct the redshift measured from the blueshifted C IV emission line to infer the systemic redshift, and the velocity offset are described by Eq. (1):
 (1)
(1)
in which Δv is the velocity shift between the measured redshift and the systemic redshift, FWHMC IV is the full width half maximum (FWHM) of C IV, REWC IV is the rest-frame equivalent width (REW) of the C IV line, and L1350 is the rest-frame monochromatic luminosity at 1350 Å. For C IV, the coefficients α = −3670 ± 549, β = 1604 ± 450, and γ = 217 ± 48, according to Dix et al. (2020). Moreover, the systemic redshift can be estimated by Eq. (2):
 (2)
(2)
where zsys and zmeas represent the systemic redshift and measured redshift, respectively, Δv is the velocity offset from Eq. (1), and c is the speed of light.
We fit a multi-Gaussian function to the C IV emission line, from which we obtained a FWHM of 4750 ± 62 km s, a REW of 27 ± 1 Å, and a measured redshift of zmeas = 2.3841 ± 0.0002. In addition, log10(L1350) was measured to be with luminosity expressed in erg per second), calculated using the median flux in the rest-frame range 1330 − 1370 Å. Based on Eqs. (1) and (2), the systemic redshift was estimated to be zC IV = 2.40 ± 0.03.
From the perspective of measurement errors, the redshift derived from Hα, zHα = 2.3908 ± 0.0003, is more accurate and was therefore adopted as our suggested best value for zsys. The systemic redshift derived from C IV is consistent with this adopted value.
Following the method of Fynbo et al. (2010), we performed spectral point spread function (SPSF) subtraction on the 2D spectra at all position angles to search for the Hα, [O II] λλ3726, 3729, and [O III] λ5007 emission lines from the host galaxy. Such lines were previously detected from DLA-galaxy counterparts (e.g., Fynbo et al. 2010). None of these emission lines were detected in any of the individual spectra nor in the combined spectrum. We also performed a 2-pixel binning of the 2D spectra to search for a possible Lyα emission line embedded within the Lyα absorption trough. No such emission feature was detected.
In Table 3, we list all absorption lines of the proximate DLA and measure their equivalent widths (EWs). Based on these absorption lines, we determined the precise redshift of the absorber to be z = 2.4007 ± 0.0003. Compared to the redshift of the quasar, this is redshifted by 864 km s−1. In our calculations, we did not use the C I absorption lines, as they include fine-structure transitions. We also excluded absorption lines that are too close to each other and therefore blended.
Absorption lines of the z = 2.4007 DLA.
In addition to the proximate DLA, we identified six other intervening systems at different redshifts. These systems, ordered by increasing redshift, are located at z = 1.7116, 1.7338, 1.7466, 1.7474, 1.8273, and 2.1859, with two, two, ten, three, five, and two identified absorption lines, respectively. The number of absorption systems in this sight line is significantly higher than what is typically observed toward quasars. A more extreme case was reported by Richards et al. (2002), where the quasar FIRST 0747+2739 was found to host 14 independent C IV absorption systems. In Stone & Richards (2019), the large-sample analysis suggests that such an overdensity of narrow, intrinsic C IV absorption lines is predominantly caused by outflows driven by accretion disk winds.
After using the VoigtFit package developed by Krogager (2018) to fit the Voigt profiles to the low-ionization metal lines, we noticed that the C IIλ1334 line exhibits additional broadening. We interpret this as evidence for the presence of the fine-structure transitions C II* λ1335.6 and λ1335.7. According to Wolfe et al. (2003a,b), C II* λ1335.7 can be used to measure the star formation rate (SFR) in DLAs. However, due to the proximity of the quasar, the pumping of the fine structure lines could also be caused by emission from the quasar itself.
3.2. Extinction
In the extinction curve, we found that our DLA does not exhibit a prominent 2175 Å bump. According to Gordon et al. (2003), the Small Magellanic Cloud (SMC) extinction curve similarly shows little to no evidence of the bump, in contrast to the prominent feature observed in the Milky Way (MW) and Large Magellanic Cloud (LMC). Therefore, we adopted the Fitzpatric & Massa (FM) parameters, i.e., the extinction parameters from Fitzpatrick & Massa (2007), corresponding to the SMC-type extinction curve. Then we performed a Markov chain Monte Carlo (MCMC) analysis to determine the optimal values of E(B − V) and RV that minimize the χ2 between the reddened quasar template and the observed spectrum. The best-fit parameters are E(B − V) = 0.3995 ± 0.0006 (this error bar is the formal error resulting from the fit, but we consider it unrealistically small) and RV = 2.8 ± 0.5. Based on these parameters, the reddened quasar template is plotted in Fig. 1. Using the dust maps (Schlegel et al. 1998; Schlafly & Finkbeiner 2011), we obtained a Milky Way reddening contribution of E(B − V) = 0.0131 ± 0.0006. This value is much lower than the extinction inferred for the absorber and can therefore be neglected.
During the MCMC fitting, we also included the Lyman-alpha absorption component in the reddened model to determine the neutral hydrogen column density of the DLA, resulting in log N(H I) = 21.214 ± 0.003 (this error bar is the formal error resulting from the fit, but we consider it unrealistically small). The Lyman-α absorption line was approximated using the Voigt-Hjerting function following the approximation of Tepper García (2006).
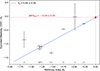 |
Fig. 3. Metallicities of the system corrected for dust using the refractory index BX, with BX values for all elements taken from Table 3 of De Cia et al. (2016) and Table 1 of Konstantopoulou et al. (2024). The blue curve represents a linear fit to Fe and Zn, with the slope δZ indicating dust depletion, and the intercept Mtot representing the corrected total metallicity of the system. Notably, Al and S lie above the curve, which can be attributed to α-enrichment. |
3.3. Metallicity
We performed the Voigt profile fitting for all singly ionized metal lines. In the fitting process, we applied the resolution of the three arms, determined by measuring the Gaussian FWHM along the spatial axis of the 2D spectrum and the linear relation given by Selsing et al. (2019). Based on the column densities of the various metals obtained from the Voigt profile fitting and the photospheric solar abundances provided by Asplund et al. (2021), we calculated the metallicity for each individual element: [Zn/H] = − 0.22 ± 0.04, [Fe/H] > − 1.16 ± 0.08, [Cr/H] = − 1.08 ± 0.08, [Si/H] > − 0.517 ± 0.05, [Mn/H] = − 1.22 ± 0.06, [Ni/H] = − 1.04 ± 0.06, [S/H] = 0.01 ± 0.54, and [Al/H] > − 0.87 ± 0.33. Hence, the system can be classified as a metal-rich DLA.
Most elements deplete onto dust grains at some level. Among all the measured metallicities, the metallicity of Zn is the closest to the metallicity of the system as Zn exists predominantly in the gas phase (Meyer & Roth 1990; Pettini & Hunstead 1990; Pettini et al. 1994). To obtain a more accurate estimate of the metallicity, we applied the dust depletion correction methods of De Cia et al. (2016). In Figure 3, we present the metallicity of all elements versus the refractory index. A linear fit using Fe and Zn yields a slope of δZ = 0.84, which represents a moderate level of dust depletion. The intercept of this curve at the origin of the BX axis corresponds to the corrected total abundance, Mtot. The intercept of this curve at BX = 0 corresponds to the corrected total abundance, Mtot = −0.04 ± 0.05, indicating that the total metallicity of the system is consistent with the solar value. Meanwhile, due to the contribution from nucleosynthesis, some elements exhibit over- or underabundances beyond dust depletion. In Figure 3, we note an α-enrichment of ∼0.2 dex in the metallicities of S and Si, indicating recent star formation activity (de La Rosa et al. 2011).
Using the metallicity, we also derived the metals-to-dust ratio of the system to be 20.95 ± 0.09 by ![Mathematical equation: $ \left(\log \frac{N_{{\mathrm{H}\,\textsc{I}}}}{\mathrm{cm^{-2}}} + [\mathrm{M/H}]\right) - \log \frac{A_V}{\mathrm{mag}} $](/articles/aa/full_html/2026/01/aa57874-25/aa57874-25-eq5.gif) . According to the study of Zafar & Watson (2013) of a sample that spans redshifts z = 0.1–6.3, the metals-to-dust ratio in quasar absorbers is approximately constant at a value of 21.2 within this redshift range. A more recent study by Heintz et al. (2023) that focused on z = 0.1–6.3 found a similar value of 21.4. Our result is in good agreement with these values.
. According to the study of Zafar & Watson (2013) of a sample that spans redshifts z = 0.1–6.3, the metals-to-dust ratio in quasar absorbers is approximately constant at a value of 21.2 within this redshift range. A more recent study by Heintz et al. (2023) that focused on z = 0.1–6.3 found a similar value of 21.4. Our result is in good agreement with these values.
Taking into account the dynamical properties of the system, we selected low-ionization metal lines that are neither saturated nor too weak, to analyze the velocity width of the system. Si IIλ 1808 and Fe IIλ 2374 proved to be excellent candidates, with measured velocity widths of 264 km s−1 and 282 km s−1, respectively. We adopted the metallicity of the system traced by zinc, [Zn/H] = −0.22 ± 0.04, and placed the two measured velocity widths in the Δv90 versus metallicity diagram, as shown in Fig. 4. The mass-metallicity relations derived from the large sample studies by Møller et al. (2013) and Ledoux et al. (2006) are also plotted for comparison. We observe that Q 2310−3358 exhibits a slightly elevated metallicity relative to the mass–metallicity relation while still following the overall trend.
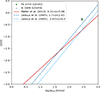 |
Fig. 4. Mass–metallicity relation of Q 2310−3358 derived through the correlation between logarithmic velocity width and metallicity, measured by two unsaturated metal lines, Fe IIλ2374 and Si IIλ1808. The two dashed blue lines show the linear relation fit by Ledoux et al. (2006) based on 70 DLAs in the redshift range 1.7 < z < 4.3, while the solid red line illustrates the linear relation from Møller et al. (2013), based on 110 DLAs spanning 0.11 < z < 5.06. |
3.4. Neutral carbon and molecules
Neutral carbon has a low ionization potential of 11.26 eV, and it is therefore not shielded by neutral hydrogen in the ISM. According to Noterdaeme et al. (2018), diffuse molecular gas such as H2 and CO is often observed with C I. In these regions, HI and dust together create a self-shielding regime: HI scatters the UV radiation, while dust attenuates the ionizing photons, thereby allowing the survival of these atoms and molecules.
We performed Voigt profile fitting for C Iλ 1277, C Iλ 1328, C Iλ 1560, C Iλ 1656, and their fine-structure levels with J = 0, 1, 2. The results, shown in Figure 5, clearly indicate the presence of C I, C I*, and C I**. The column density of C I is log N(C I) = 14.08 ± 0.09, while the column densities of the fine-structure levels J = 1, 2, C I* and C I**, are 14.050 ± 0.078 and 13.623 ± 0.103, respectively. Such a strong DLA exhibiting C I absorption is very rare among quasar absorbers, as the main population of C I absorbers has been found in sub-DLAs with N(H I) = 2 × 10²⁰ (Ledoux et al. 2015). In addition, C I absorption is more frequently detected in gamma-ray burst (GRB) host galaxies than in quasar absorption systems, as it also tends to arise in environments with relatively high metallicity and dust content (Heintz et al. 2019a,b; Heintz & Watson 2020).
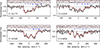 |
Fig. 5. Voigt profile fitting of four multiplets of C I. The spectrum is shown as the black line with the best-fitting model overlaid as the solid red curve. Each of the blue tick marks indicates the position of a velocity component of either the ground level (J = 0) or the two excited fine-structure levels (J = 1 and J = 2). The small panel on top of each sub-figure shows the residuals of the fit in the given region. |
Due to the self-shielding regime, the successful detection of strong C I absorption often implies the coexistence of H2 and CO molecules in the DLA (Liszt 1981; Srianand et al. 2005; Noterdaeme et al. 2018). To characterize the molecular hydrogen absorption, we fit the H2 lines from different vibrational and rotational levels using Voigt profile fitting, under the assumption of two velocity components, as shown in Fig. 6. In this framework, the H2 transitions are denoted as BX(ν − 0) for the Lyman band, which corresponds to those from the vibrational level ν of the excited B state to the vibrational ground level of the X state.
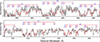 |
Fig. 6. Voigt profile fitting of H2 lines from rotational and vibrational levels. The red line shows the best-fit model using VoigtFit, and the blue tick marks show the location of the various rotational transitions (0–4) of each of the vibrational bands (ν) to the ground state denoted as BX(ν − 0). The model assumes two velocity components. |
The population distribution of the rotational excitation of molecular hydrogen can be described using the Boltzmann distribution by Eq. (3):
 (3)
(3)
where g(H2,J) and g(H2,J′) are the degeneracies of the J and J′ levels, respectively, while N(H2,J) and N(H2,J′) represent the corresponding column densities.
In logarithmic form and for J = 0, Eq. (3) can be written as a linear relation of ln(NJ/N0 g0/gJ) versus EJ − E0, with a slope of −1/kT. At high column densities, T01 is often used to represent the kinetic temperature of the H2 gas (Roy et al. 2006). Therefore, we performed a linear fit for the J = 0 and J = 1 levels (see Fig. 7), obtaining an excitation temperature of  . This is a relatively low excitation temperature, significantly lower than the typical values of T01 ∼ 130–160 K in low-redshift and high-redshift DLA samples (Srianand et al. 2005; Muzahid et al. 2015), but very close to 77 K in the Galactic disk and 71 K in the Magellanic Clouds (MCs) (Savage et al. 1977; Rachford et al. 2002; Welty et al. 2012).
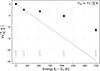 |
Fig. 7. Excitation diagram of H2 showing the population of rotational levels relative to the ground state. The straight dotted line shows the best-fit model of the excitation temperature derived from the first two J-levels assuming a Boltzmann distribution. Higher order levels indicate higher excitation, which is commonly observed (Noterdaeme et al. 2017). |
In addition, we find excess excitation for the J ≥ 2 rotational levels. A stronger excitation of the higher J-levels is commonly observed as previously reported (Noterdaeme et al. 2017). However, in our case, the excess is particularly pronounced even for J = 2, which could indicate photon pumping by a strong UV radiation field.
Figure 8 shows the constraints on the physical conditions of the absorbing gas obtained from the relative populations of the C I fine-structure levels. The confidence regions (1–3σ) are derived independently from three line ratios of J = 0, 1, 2. Each ratio provides a distinct locus in the temperature–density plane, reflecting the different sensitivities of the fine-structure transitions to collisional excitation (Jorgenson et al. 2010). The overlapping region of the three constraints defines the most probable range of hydrogen density and kinetic temperature. In the present analysis, we assume a strong UV radiation field and excitation temperature of Tex = 71 K, as inferred from the H2 rotational levels. The resulting joint constraints favor a cold and fairly high density phase, with an nH of ∼1000 cm−3. If the ambient UV radiation field is weaker or the kinetic temperature is higher, the required density could be slightly lower, down to around 600 cm−3. Moreover, We derived an upper limit on the CO column density, finding log N(CO) < 13.9, which is consistent with the measured C I column density of ∼14.3, following the relation reported by Noterdaeme et al. (2018) for intervening absorbers.
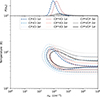 |
Fig. 8. Constraints on temperature vs. hydrogen density from the relative population of C I fine-structure levels. The contours show 1–3 sigma confidence regions (dark to light shading) from three different line ratios (J = 1 to J = 0, dashed blue; J = 2 to J = 0, dotted red; and J = 2 to J = 1, solid black). All constraints assume an excitation temperature of 71 K derived from H2 rotational levels. |
4. Discussion and conclusions
Q 2310−3358 is a dust-reddened quasar with a strong, metal-rich proximate DLA. It was selected using a specific Gaia-based astrometric method combined with a photometric selection rule, which has been shown to efficiently select hitherto overlooked reddened quasars – in this case a quasar reddened by a proximate dusty DLA. By comparing with Figure 9 of Noterdaeme et al. (2023), we find that Q 2310–3358, similar to other known proximate molecular absorbers, lies at the upper edge of the expected dust-bias trend (Boisse et al. 1998). Since the sample of Noterdaeme et al. (2023) was optically selected from SDSS, the presence of dust bias may have caused many such absorbers to be overlooked.
In several aspects, Q 2310−3358 follows the correlations observed for intervening DLAs. It is consistent with the approximately constant metal-to-dust ratio found in large-sample studies (Zafar & Watson 2013; Heintz et al. 2023) and also aligns with previous results on the mass–metallicity relation (Ledoux et al. 2006; Møller et al. 2013).
Using the Hα and the corrected C IV emission lines, we obtained quasar redshifts of zem = 2.3909 ± 0.0022 and zem = 2.40 ± 0.03, respectively. The absorber has a redshift of zabs = 2.4007 ± 0.0003, i.e., redshifted by 864 km s−1 relative to the quasar. Such large relative velocities are common in proximate DLAs (Ellison et al. 2010). In Noterdaeme et al. (2023), Fig. 11 presents 13 proximate molecular quasar absorbers with velocities relative to their quasars, showing an average redshift of 250 km s−1, which is significantly lower than the value we measured. Only a very small number of systems reach relative velocities comparable to ours.
If we adopt the redshift of the quasar measured from the Hα emission line and consider the precisely determined absorber redshift of zabs = 2.4007, this quasar absorption-line system represents a peculiar case where zem < zabs. How such a scenario can occur was already discussed by Weymann & Williams (1978). The relative redshifts imply that the absorption system and the quasar are moving toward one another. Given its very high relative velocity (875 km s−1), this suggests that the absorber is either a foreground galaxy with a large peculiar velocity within the quasar group environment, or gas in-falling toward the central engine at high velocity, as typical galactic motions are on the order of a few hundred kilometers per second. Considering the other indications of very high metallicity, strong excitation of H2, and high density inferred from C I, we regard the latter scenario as more plausible. Altogether, these properties could arise in a highly disturbed host galaxy following a merger event, which would both trigger active galactic nucleus (AGN) activity and induce a strong starburst, naturally explaining the observed α-enhancement.
Considering that the excess excitation at the J = 2 rotational level implies the influence of photon pumping by a strong UV background, we infer that the quasar and the DLA are likely to be in very close proximity. Also from this perspective, the second explanation appears more plausible.
The detection of C I and its fine-structure levels is important for understanding the physical conditions within molecular clouds. By analyzing the three C I levels, we constrained the excitation temperature to be T01 ∼ 71 K and the gas density of the system to be nH ∼ 1000 cm−3. These conditions are essential for the survival of H2 and CO. An upper limit was derived for CO (log N(CO) < 13.9). The coexistence of CO with H2 and C I supports the presence of a self-shielded regime (Noterdaeme et al. 2018).
Clear detections of C I and H2 are very rare (Ledoux et al. 2015). The system exhibits significant metal enrichment ([M/H]tot = −0.04) and strong dust reddening. Such DLAs are rarely observed, and this work provides a new valuable example of this rare type of absorption systems. Similarly, previous studies of another absorber with zem ≃ zabs, Q0528−250, have also revealed the presence of C I and H2, which allowed constraints to be placed on the physical conditions. Srianand & Petitjean (1998) reported the first detection of H2 in Q0528−250 and demonstrated that the presence of dust plays a crucial role in facilitating H2 formation. Balashev et al. (2020) further investigated this DLA and estimated the distance between the quasar and the absorbing cloud, which constrained the physical conditions of the gas in Q0528−250 to an excitation temperature of ∼150 K and a hydrogen number density of nH ∼ 200 cm−3. In contrast, our DLA exhibits a more peculiar environment with a lower temperature (71 K) and a higher density (∼103 cm−3), which may be related to the high metallicity of Q 2310−3358. Another comparable case is the study by Balashev et al. (2025) on J012555.11−012925.00, a merging galaxy system at z = 2.7. The companion galaxy exhibits DLA characteristics and is also classified as a proximate DLA. Compared to this system, Q 2310−3358 shows a much higher metallicity, implying a more evolved and actively star-forming environment. J012555.11−012925.00 also exhibits a lower velocity of about 550 km s−1, further highlighting that our DLA has an unusually high redshift relative to the quasar.
Acknowledgments
The Cosmic Dawn Center (DAWN) is funded by the Danish National Research Foundation under grant No. 140. JPUF is supported by the Independent Research Fund Denmark (DFF–4090-00079). LC is supported by the Independent Research Fund Denmark (DFF-2032-00071). J.K.K. is supported by the French Agence Nationale de la Recherche (ANR) under grant number ANR-24-CE31-7454 (CI-CNM). This research has made use of the VizieR catalog access tool, CDS, Strasbourg Astronomical Observatory, France (DOI : 10.26093/cds/vizier).
References
- Asplund, M., Amarsi, A. M., & Grevesse, N. 2021, A&A, 653, A141 [NASA ADS] [CrossRef] [EDP Sciences] [Google Scholar]
- Balashev, S. A., Ledoux, C., Noterdaeme, P., et al. 2020, MNRAS, 497, 1946 [NASA ADS] [CrossRef] [Google Scholar]
- Balashev, S., Noterdaeme, P., Gupta, N., et al. 2025, Nature, 641, 1137 [Google Scholar]
- Boisse, P., Le Brun, V., Bergeron, J., & Deharveng, J.-M. 1998, A&A, 333, 841 [Google Scholar]
- De Cia, A., Ledoux, C., Mattsson, L., et al. 2016, A&A, 596, A97 [NASA ADS] [CrossRef] [EDP Sciences] [Google Scholar]
- de Jong, J. T. A., Verdoes Kleijn, G. A., Kuijken, K. H., & Valentijn, E. A. 2013, Exp. Astron., 35, 25 [Google Scholar]
- de La Rosa, I. G., La Barbera, F., Ferreras, I., & de Carvalho, R. R. 2011, MNRAS, 418, L74 [NASA ADS] [CrossRef] [Google Scholar]
- Dix, C., Shemmer, O., Brotherton, M. S., et al. 2020, ApJ, 893, 14 [NASA ADS] [CrossRef] [Google Scholar]
- Edge, A., Sutherland, W., Kuijken, K., et al. 2013, Messenger, 154, 32 [Google Scholar]
- Ellison, S. L., Prochaska, J. X., Hennawi, J., et al. 2010, MNRAS, 406, 1435 [NASA ADS] [Google Scholar]
- Fall, S. M., & Pei, Y. C. 1989, ApJ, 337, 7 [Google Scholar]
- Fitzpatrick, E. L., & Massa, D. 2007, ApJ, 663, 320 [Google Scholar]
- Fynbo, J. P. U., Laursen, P., Ledoux, C., et al. 2010, MNRAS, 408, 2128 [NASA ADS] [CrossRef] [Google Scholar]
- Geier, S. J., Heintz, K. E., Fynbo, J. P. U., et al. 2019, A&A, 625, L9 [NASA ADS] [CrossRef] [EDP Sciences] [Google Scholar]
- Glikman, E., Urrutia, T., Lacy, M., et al. 2013, ApJ, 778, 127 [Google Scholar]
- Glikman, E., Lacy, M., LaMassa, S., et al. 2018, ApJ, 861, 37 [NASA ADS] [CrossRef] [Google Scholar]
- Glikman, E., Lacy, M., LaMassa, S., et al. 2022, ApJ, 934, 119 [NASA ADS] [CrossRef] [Google Scholar]
- Gordon, K. D., Clayton, G. C., Misselt, K. A., Landolt, A. U., & Wolff, M. J. 2003, ApJ, 594, 279 [NASA ADS] [CrossRef] [Google Scholar]
- Greenstein, J. L., & Schmidt, M. 1964, ApJ, 140, 1 [NASA ADS] [CrossRef] [Google Scholar]
- Heintz, K. E., & Watson, D. 2020, ApJ, 889, L7 [Google Scholar]
- Heintz, K. E., Fynbo, J. P. U., & Høg, E. 2015, A&A, 578, A91 [NASA ADS] [CrossRef] [EDP Sciences] [Google Scholar]
- Heintz, K. E., Fynbo, J. P. U., Høg, E., et al. 2018a, A&A, 615, L8 [NASA ADS] [CrossRef] [EDP Sciences] [Google Scholar]
- Heintz, K. E., Fynbo, J. P. U., Ledoux, C., et al. 2018b, A&A, 615, A43 [NASA ADS] [CrossRef] [EDP Sciences] [Google Scholar]
- Heintz, K. E., Ledoux, C., Fynbo, J. P. U., et al. 2019a, A&A, 621, A20 [NASA ADS] [CrossRef] [EDP Sciences] [Google Scholar]
- Heintz, K. E., Bolmer, J., Ledoux, C., et al. 2019b, A&A, 629, A131 [NASA ADS] [CrossRef] [EDP Sciences] [Google Scholar]
- Heintz, K. E., Fynbo, J. P. U., Geier, S. J., et al. 2020, A&A, 644, A17 [NASA ADS] [CrossRef] [EDP Sciences] [Google Scholar]
- Heintz, K. E., De Cia, A., Thöne, C. C., et al. 2023, A&A, 679, A91 [NASA ADS] [CrossRef] [EDP Sciences] [Google Scholar]
- Hewett, P. C., & Wild, V. 2010, MNRAS, 405, 2302 [NASA ADS] [Google Scholar]
- Jorgenson, R. A., Wolfe, A. M., & Prochaska, J. X. 2010, ApJ, 722, 460 [NASA ADS] [CrossRef] [Google Scholar]
- Konstantopoulou, C., De Cia, A., Krogager, J.-K., et al. 2024, A&A, 691, A129 [NASA ADS] [CrossRef] [EDP Sciences] [Google Scholar]
- Krogager, J. K. 2018, ArXiv e-prints [arXiv:1803.01187] [Google Scholar]
- Krogager, J. K., Fynbo, J. P. U., Heintz, K. E., et al. 2016a, ApJ, 832, 49 [CrossRef] [Google Scholar]
- Krogager, J. K., Fynbo, J. P. U., Noterdaeme, P., et al. 2016b, MNRAS, 455, 2698 [NASA ADS] [CrossRef] [Google Scholar]
- Krogager, J.-K., Fynbo, J. P. U., Møller, P., et al. 2019, MNRAS, 486, 4377 [NASA ADS] [CrossRef] [Google Scholar]
- Ledoux, C., Petitjean, P., Fynbo, J. P. U., Møller, P., & Srianand, R. 2006, A&A, 457, 71 [NASA ADS] [CrossRef] [EDP Sciences] [Google Scholar]
- Ledoux, C., Noterdaeme, P., Petitjean, P., & Srianand, R. 2015, A&A, 580, A8 [NASA ADS] [CrossRef] [EDP Sciences] [Google Scholar]
- Liszt, H. S. 1981, ApJ, 246, L147 [Google Scholar]
- Meyer, D. M., & Roth, K. C. 1990, ApJ, 363, 57 [Google Scholar]
- Modigliani, A., Goldoni, P., Royer, F., et al. 2010, SPIE Conf. Ser., 7737, 773728 [Google Scholar]
- Møller, P., Warren, S. J., & Fynbo, J. U. 1998, A&A, 330, 19 [NASA ADS] [Google Scholar]
- Møller, P., Fynbo, J. P. U., Ledoux, C., & Nilsson, K. K. 2013, MNRAS, 430, 2680 [CrossRef] [Google Scholar]
- Muzahid, S., Srianand, R., & Charlton, J. 2015, MNRAS, 448, 2840 [Google Scholar]
- Noterdaeme, P., Krogager, J.-K., Balashev, S., et al. 2017, A&A, 597, A82 [NASA ADS] [CrossRef] [EDP Sciences] [Google Scholar]
- Noterdaeme, P., Ledoux, C., Zou, S., et al. 2018, A&A, 612, A58 [NASA ADS] [CrossRef] [EDP Sciences] [Google Scholar]
- Noterdaeme, P., Balashev, S., Krogager, J. K., et al. 2019, A&A, 627, A32 [NASA ADS] [CrossRef] [EDP Sciences] [Google Scholar]
- Noterdaeme, P., Balashev, S., Cuellar, R., et al. 2023, A&A, 673, A89 [NASA ADS] [CrossRef] [EDP Sciences] [Google Scholar]
- Pei, Y. C., Fall, S. M., & Bechtold, J. 1991, ApJ, 378, 6 [Google Scholar]
- Pettini, M., & Hunstead, R. W. 1990, Aust. J. Phys., 43, 227 [Google Scholar]
- Pettini, M., Smith, L. J., Hunstead, R. W., & King, D. L. 1994, ApJ, 426, 79 [NASA ADS] [CrossRef] [Google Scholar]
- Pontzen, A., & Pettini, M. 2009, MNRAS, 393, 557 [Google Scholar]
- Rachford, B. L., Baker, E. J., & Snow, T. P. 2002, Am. Astron. Soc. Meet. Abstr., 201, 77.02 [Google Scholar]
- Richards, G. T., Gregg, M. D., Becker, R. H., & White, R. L. 2002, ApJ, 567, L13 [Google Scholar]
- Roy, N., Chengalur, J. N., & Srianand, R. 2006, MNRAS, 365, L1 [Google Scholar]
- Sandage, A., Véron, P., & Wyndham, J. D. 1965, ApJ, 142, 1307 [Google Scholar]
- Savage, B. D., Bohlin, R. C., Drake, J. F., & Budich, W. 1977, ApJ, 216, 291 [NASA ADS] [CrossRef] [Google Scholar]
- Schlafly, E. F., & Finkbeiner, D. P. 2011, ApJ, 737, 103 [Google Scholar]
- Schlegel, D. J., Finkbeiner, D. P., & Davis, M. 1998, ApJ, 500, 525 [Google Scholar]
- Schmidt, M. 1963, Nature, 197, 1040 [Google Scholar]
- Selsing, J., Fynbo, J. P. U., Christensen, L., & Krogager, J. K. 2016, A&A, 585, A87 [NASA ADS] [CrossRef] [EDP Sciences] [Google Scholar]
- Selsing, J., Malesani, D., Goldoni, P., et al. 2019, A&A, 623, A92 [NASA ADS] [CrossRef] [EDP Sciences] [Google Scholar]
- Shen, Y., Brandt, W. N., Richards, G. T., et al. 2016, ApJ, 831, 7 [NASA ADS] [CrossRef] [Google Scholar]
- Srianand, R., & Petitjean, P. 1998, A&A, 335, 33 [NASA ADS] [Google Scholar]
- Srianand, R., Petitjean, P., Ledoux, C., Ferland, G., & Shaw, G. 2005, MNRAS, 362, 549 [Google Scholar]
- Stern, D., Assef, R. J., Benford, D. J., et al. 2012, ApJ, 753, 30 [Google Scholar]
- Stone, R. B., & Richards, G. T. 2019, MNRAS, 488, 5916 [NASA ADS] [CrossRef] [Google Scholar]
- Tepper García, T. 2006, MNRAS, 369, 2025 [CrossRef] [Google Scholar]
- Tytler, D., & Fan, X.-M. 1992, ApJS, 79, 1 [NASA ADS] [CrossRef] [Google Scholar]
- Warren, S. J., Hewett, P. C., & Foltz, C. B. 2000, MNRAS, 312, 827 [NASA ADS] [CrossRef] [Google Scholar]
- Webster, R. L., Francis, P. J., Petersont, B. A., Drinkwater, M. J., & Masci, F. J. 1995, Nature, 375, 469 [Google Scholar]
- Welty, D. E., Xue, R., & Wong, T. 2012, ApJ, 745, 173 [NASA ADS] [CrossRef] [Google Scholar]
- Weymann, R. J., & Williams, R. E. 1978, Phys. Scr., 17, 217 [Google Scholar]
- Weymann, R. J., Williams, R. E., Beaver, E. A., & Miller, J. S. 1977, ApJ, 213, 619 [Google Scholar]
- Wolfe, A. M., Turnshek, D. A., Smith, H. E., & Cohen, R. D. 1986, ApJS, 61, 249 [NASA ADS] [CrossRef] [Google Scholar]
- Wolfe, A. M., Gawiser, E., & Prochaska, J. X. 2003a, ApJ, 593, 235 [Google Scholar]
- Wolfe, A. M., Prochaska, J. X., & Gawiser, E. 2003b, ApJ, 593, 215 [NASA ADS] [CrossRef] [Google Scholar]
- Wright, E. L., Eisenhardt, P. R. M., Mainzer, A. K., et al. 2010, AJ, 140, 1868 [Google Scholar]
- Zafar, T., & Watson, D. 2013, A&A, 560, A26 [NASA ADS] [CrossRef] [EDP Sciences] [Google Scholar]
All Tables
All Figures
|
Fig. 1. Spectrum of Q 2310-3358 obtained with VLT/X-Shooter (black curve), with the positions of the prominent quasar emission lines indicated by dashed purple lines. The blue curve represents the composite quasar spectrum from Selsing et al. (2016). A reddened template is plotted in red using the best-fit extinction parameters, along with the addition of a Lyα absorption line corresponding to log N(H I) = 21.21 ± 0.003. The inset provides a zoomed-in view of the Lyα line from the absorber. Gray bands mark the regions where the spectrum is unreliable due to X-Shooter arm overlaps and telluric absorption. |
| In the text | |
|
Fig. 2. Upper panel: Two single-Gaussian profiles fit to the Hα emission line. The red curve shows the fit after masking the artifacts (marked by the red bands), while the blue curve displays the result when the artifacts are not masked. Bottom: Fitting residuals, where the gray shading denotes the 1σ uncertainty of the spectrum. In both cases, the sky-line regions are masked out, as indicated by the blue bands. The mean (μG), standard deviation (σG), and FWHMG (corrected for the instrument resolution of 39.377 km s−1) of the fit are listed in the plot. |
| In the text | |
|
Fig. 3. Metallicities of the system corrected for dust using the refractory index BX, with BX values for all elements taken from Table 3 of De Cia et al. (2016) and Table 1 of Konstantopoulou et al. (2024). The blue curve represents a linear fit to Fe and Zn, with the slope δZ indicating dust depletion, and the intercept Mtot representing the corrected total metallicity of the system. Notably, Al and S lie above the curve, which can be attributed to α-enrichment. |
| In the text | |
|
Fig. 4. Mass–metallicity relation of Q 2310−3358 derived through the correlation between logarithmic velocity width and metallicity, measured by two unsaturated metal lines, Fe IIλ2374 and Si IIλ1808. The two dashed blue lines show the linear relation fit by Ledoux et al. (2006) based on 70 DLAs in the redshift range 1.7 < z < 4.3, while the solid red line illustrates the linear relation from Møller et al. (2013), based on 110 DLAs spanning 0.11 < z < 5.06. |
| In the text | |
|
Fig. 5. Voigt profile fitting of four multiplets of C I. The spectrum is shown as the black line with the best-fitting model overlaid as the solid red curve. Each of the blue tick marks indicates the position of a velocity component of either the ground level (J = 0) or the two excited fine-structure levels (J = 1 and J = 2). The small panel on top of each sub-figure shows the residuals of the fit in the given region. |
| In the text | |
|
Fig. 6. Voigt profile fitting of H2 lines from rotational and vibrational levels. The red line shows the best-fit model using VoigtFit, and the blue tick marks show the location of the various rotational transitions (0–4) of each of the vibrational bands (ν) to the ground state denoted as BX(ν − 0). The model assumes two velocity components. |
| In the text | |
|
Fig. 7. Excitation diagram of H2 showing the population of rotational levels relative to the ground state. The straight dotted line shows the best-fit model of the excitation temperature derived from the first two J-levels assuming a Boltzmann distribution. Higher order levels indicate higher excitation, which is commonly observed (Noterdaeme et al. 2017). |
| In the text | |
|
Fig. 8. Constraints on temperature vs. hydrogen density from the relative population of C I fine-structure levels. The contours show 1–3 sigma confidence regions (dark to light shading) from three different line ratios (J = 1 to J = 0, dashed blue; J = 2 to J = 0, dotted red; and J = 2 to J = 1, solid black). All constraints assume an excitation temperature of 71 K derived from H2 rotational levels. |
| In the text | |
Current usage metrics show cumulative count of Article Views (full-text article views including HTML views, PDF and ePub downloads, according to the available data) and Abstracts Views on Vision4Press platform.
Data correspond to usage on the plateform after 2015. The current usage metrics is available 48-96 hours after online publication and is updated daily on week days.
Initial download of the metrics may take a while.