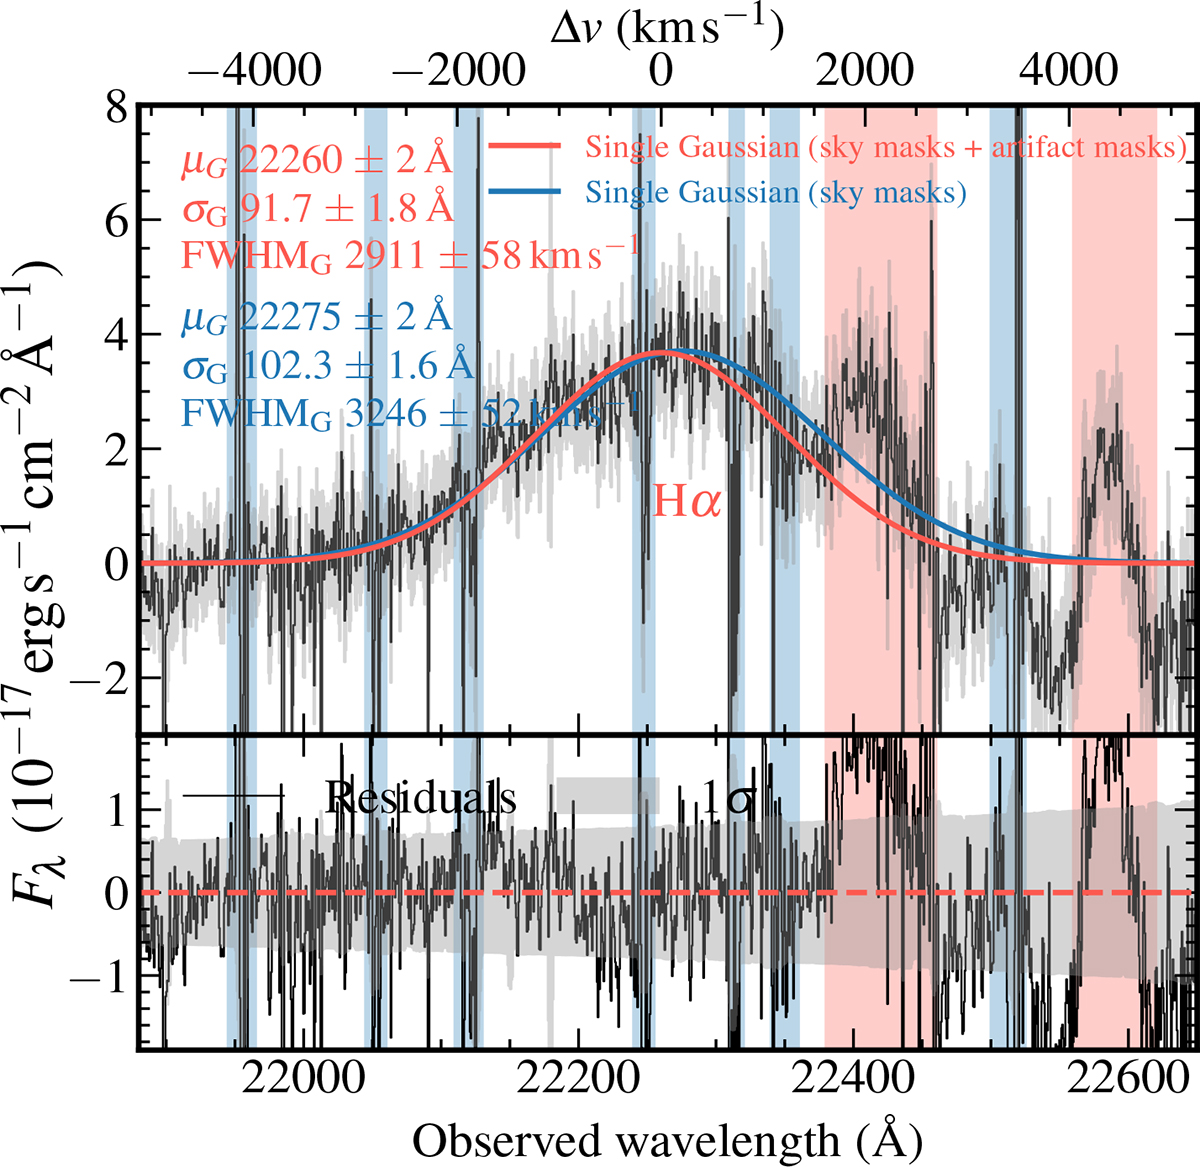
Fig. 2.
Download original image
Upper panel: Two single-Gaussian profiles fit to the Hα emission line. The red curve shows the fit after masking the artifacts (marked by the red bands), while the blue curve displays the result when the artifacts are not masked. Bottom: Fitting residuals, where the gray shading denotes the 1σ uncertainty of the spectrum. In both cases, the sky-line regions are masked out, as indicated by the blue bands. The mean (μG), standard deviation (σG), and FWHMG (corrected for the instrument resolution of 39.377 km s−1) of the fit are listed in the plot.
Current usage metrics show cumulative count of Article Views (full-text article views including HTML views, PDF and ePub downloads, according to the available data) and Abstracts Views on Vision4Press platform.
Data correspond to usage on the plateform after 2015. The current usage metrics is available 48-96 hours after online publication and is updated daily on week days.
Initial download of the metrics may take a while.