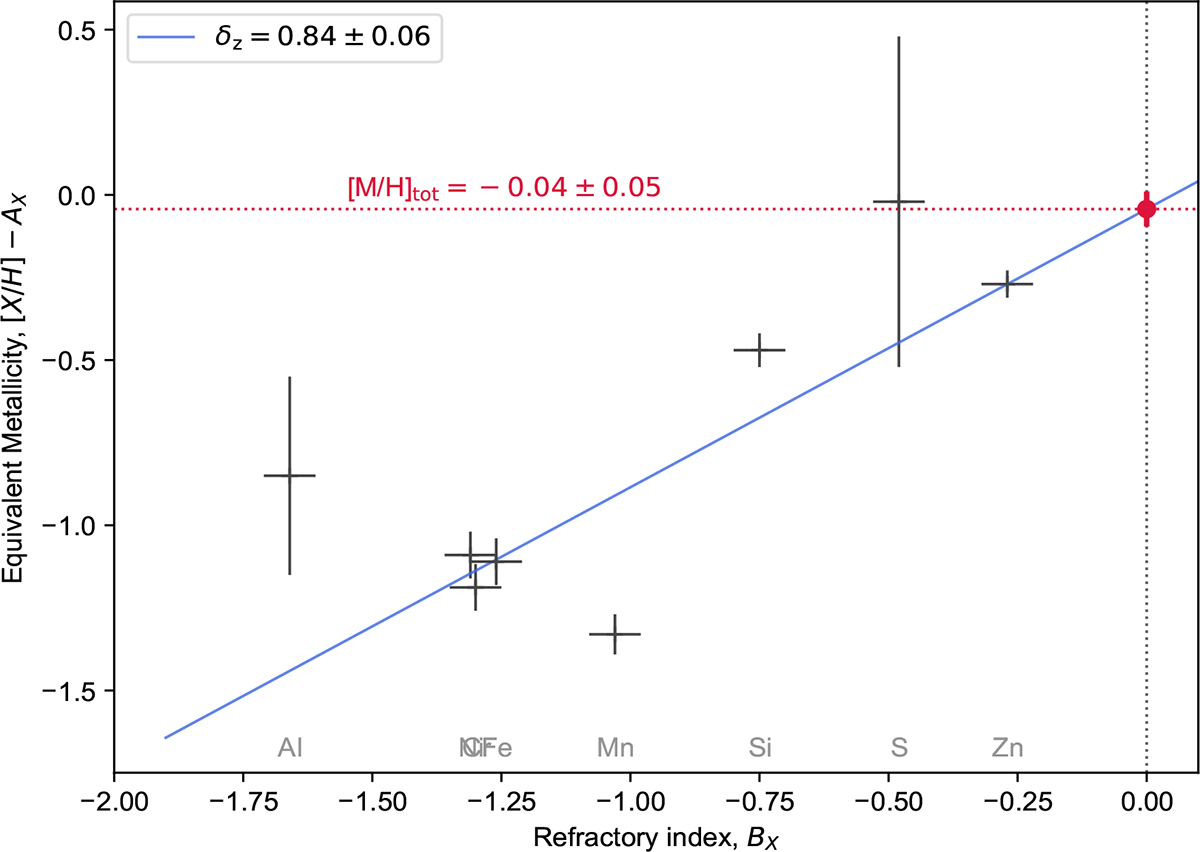
Fig. 3.
Download original image
Metallicities of the system corrected for dust using the refractory index BX, with BX values for all elements taken from Table 3 of De Cia et al. (2016) and Table 1 of Konstantopoulou et al. (2024). The blue curve represents a linear fit to Fe and Zn, with the slope δZ indicating dust depletion, and the intercept Mtot representing the corrected total metallicity of the system. Notably, Al and S lie above the curve, which can be attributed to α-enrichment.
Current usage metrics show cumulative count of Article Views (full-text article views including HTML views, PDF and ePub downloads, according to the available data) and Abstracts Views on Vision4Press platform.
Data correspond to usage on the plateform after 2015. The current usage metrics is available 48-96 hours after online publication and is updated daily on week days.
Initial download of the metrics may take a while.