Fig. 5.
Download original image
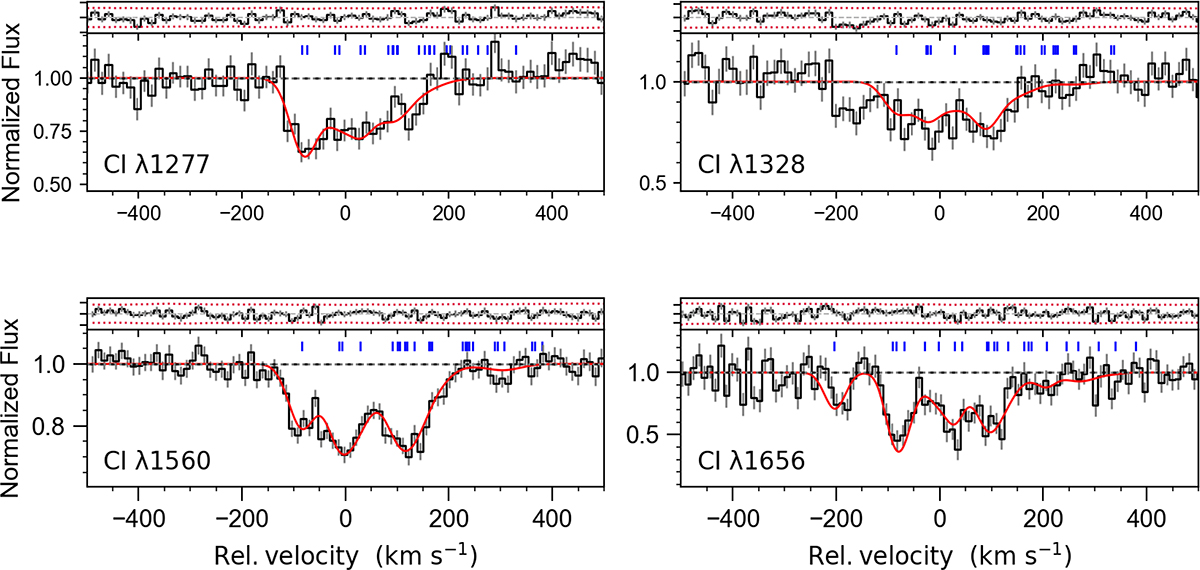
Voigt profile fitting of four multiplets of C I. The spectrum is shown as the black line with the best-fitting model overlaid as the solid red curve. Each of the blue tick marks indicates the position of a velocity component of either the ground level (J = 0) or the two excited fine-structure levels (J = 1 and J = 2). The small panel on top of each sub-figure shows the residuals of the fit in the given region.
Current usage metrics show cumulative count of Article Views (full-text article views including HTML views, PDF and ePub downloads, according to the available data) and Abstracts Views on Vision4Press platform.
Data correspond to usage on the plateform after 2015. The current usage metrics is available 48-96 hours after online publication and is updated daily on week days.
Initial download of the metrics may take a while.