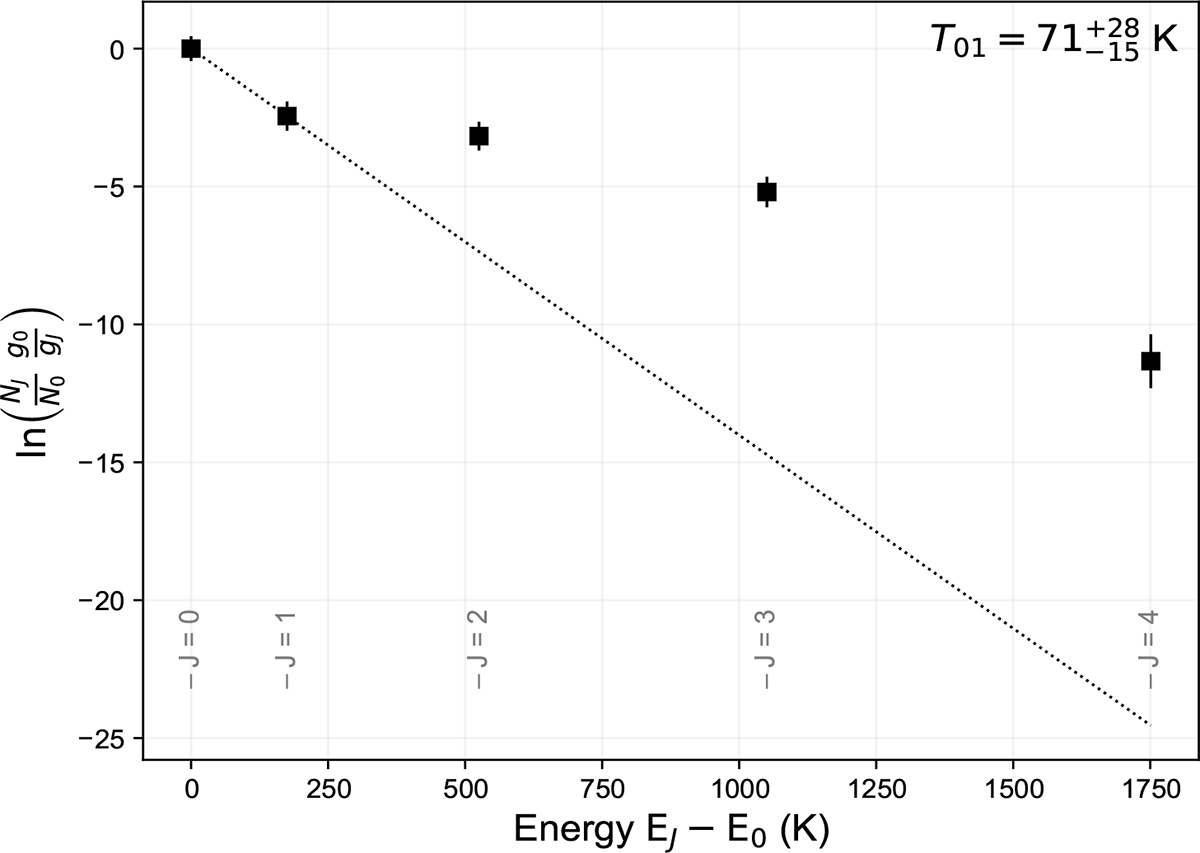
Fig. 7.
Download original image
Excitation diagram of H2 showing the population of rotational levels relative to the ground state. The straight dotted line shows the best-fit model of the excitation temperature derived from the first two J-levels assuming a Boltzmann distribution. Higher order levels indicate higher excitation, which is commonly observed (Noterdaeme et al. 2017).
Current usage metrics show cumulative count of Article Views (full-text article views including HTML views, PDF and ePub downloads, according to the available data) and Abstracts Views on Vision4Press platform.
Data correspond to usage on the plateform after 2015. The current usage metrics is available 48-96 hours after online publication and is updated daily on week days.
Initial download of the metrics may take a while.