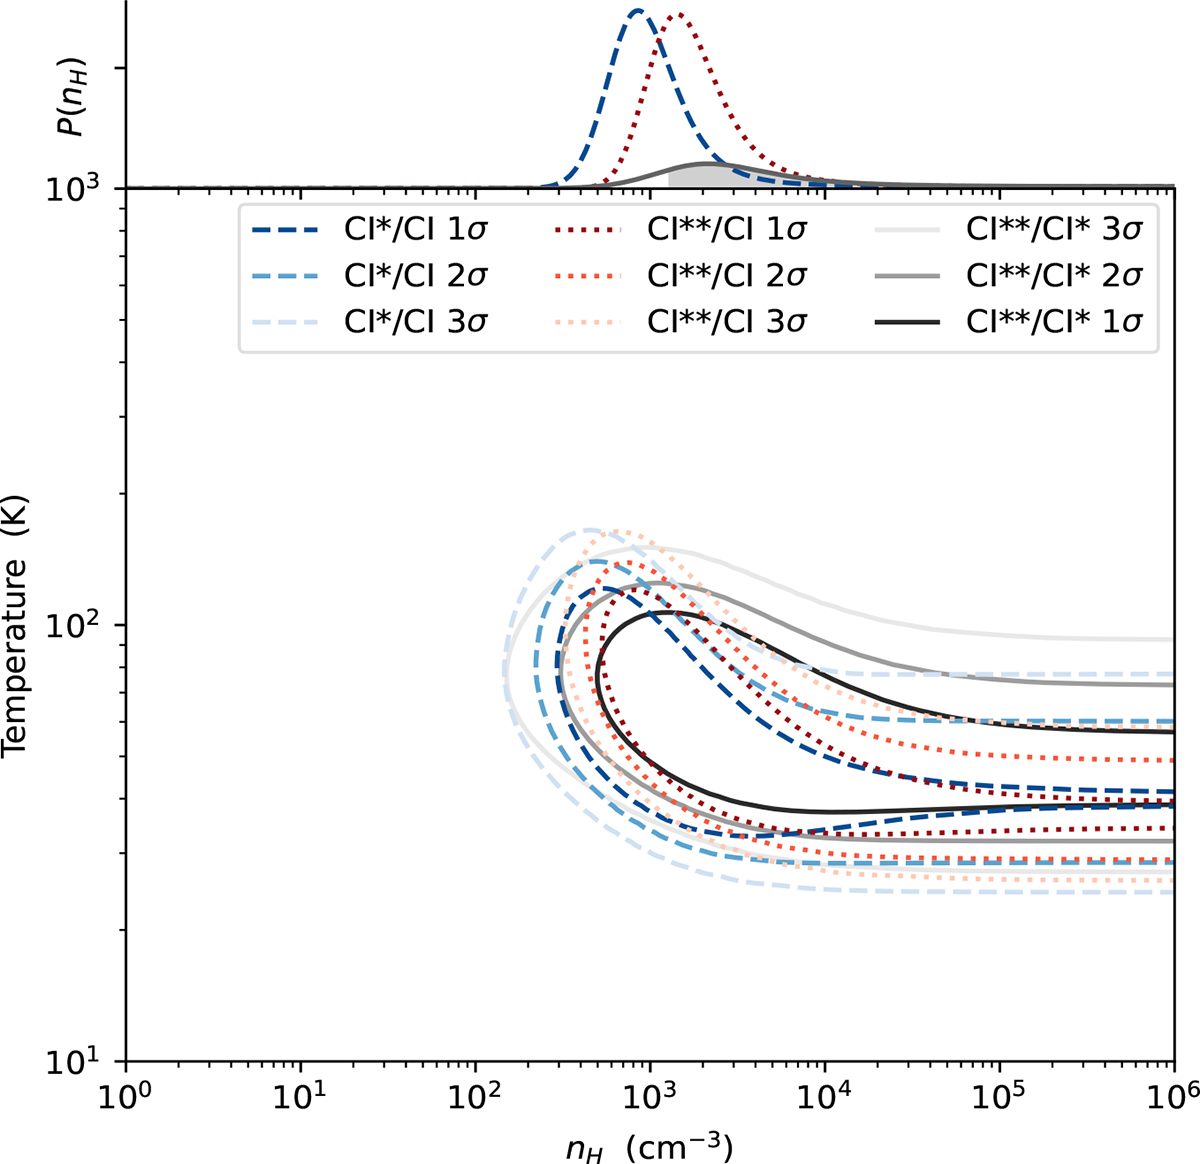
Fig. 8.
Download original image
Constraints on temperature vs. hydrogen density from the relative population of C I fine-structure levels. The contours show 1–3 sigma confidence regions (dark to light shading) from three different line ratios (J = 1 to J = 0, dashed blue; J = 2 to J = 0, dotted red; and J = 2 to J = 1, solid black). All constraints assume an excitation temperature of 71 K derived from H2 rotational levels.
Current usage metrics show cumulative count of Article Views (full-text article views including HTML views, PDF and ePub downloads, according to the available data) and Abstracts Views on Vision4Press platform.
Data correspond to usage on the plateform after 2015. The current usage metrics is available 48-96 hours after online publication and is updated daily on week days.
Initial download of the metrics may take a while.