Open Access
Fig. C.1.
Download original image
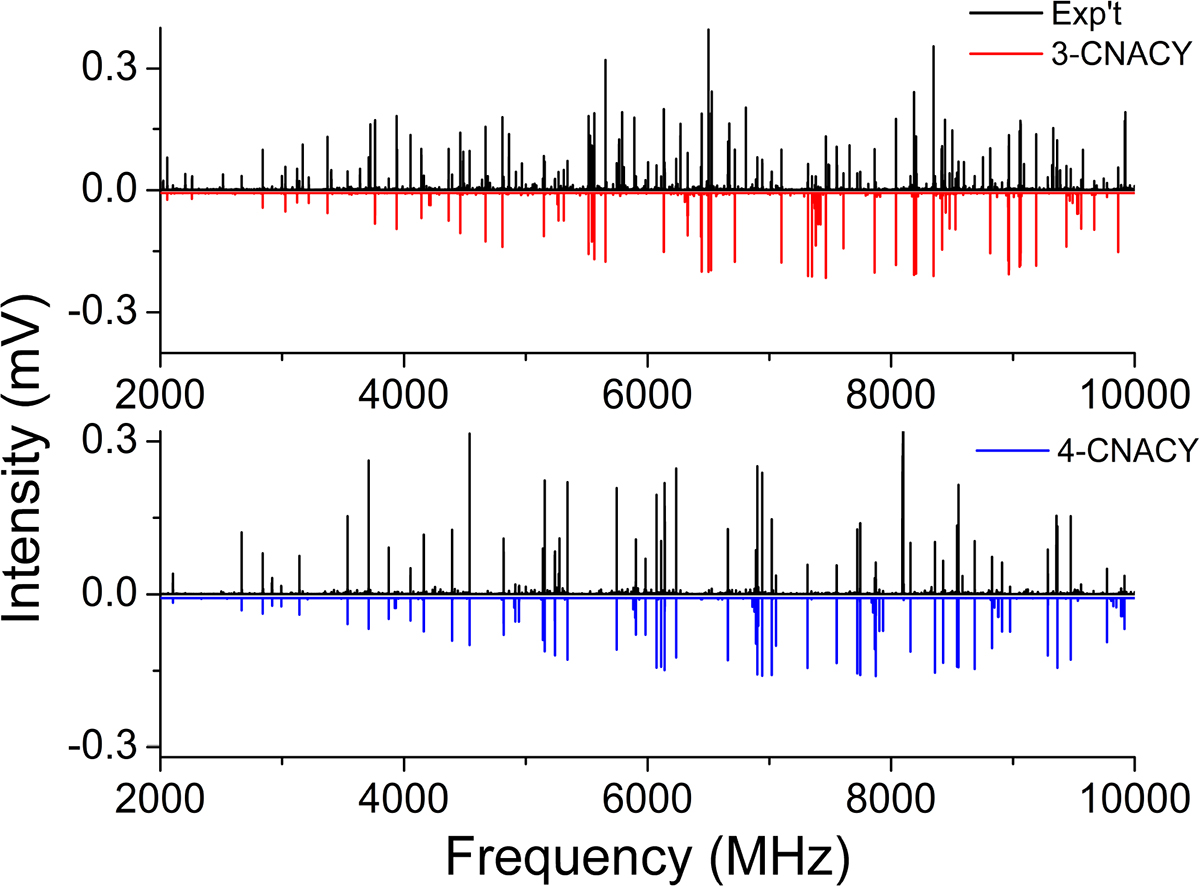
Broadband microwave spectra of 3-CNACY and 4-CNACY in the region 2-10 GHz. The experimental trace is represented by the positive black trace. The negative red and blue traces are simulations (at 2 K) using the fitted rotational parameters of Table 1.
Current usage metrics show cumulative count of Article Views (full-text article views including HTML views, PDF and ePub downloads, according to the available data) and Abstracts Views on Vision4Press platform.
Data correspond to usage on the plateform after 2015. The current usage metrics is available 48-96 hours after online publication and is updated daily on week days.
Initial download of the metrics may take a while.