| Issue |
A&A
Volume 705, January 2026
|
|
|---|---|---|
| Article Number | L7 | |
| Number of page(s) | 8 | |
| Section | Letters to the Editor | |
| DOI | https://doi.org/10.1051/0004-6361/202557893 | |
| Published online | 07 January 2026 | |
Letter to the Editor
Discovery of two new isomers of cyanoacenaphthylene (C12H7CN) in the Taurus molecular cloud 1 with the QUIJOTE line survey
1
Dept. de Astrofísica Molecular, Instituto de Física Fundamental (IFF-CSIC), C/ Serrano 121, 28006 Madrid, Spain
2
Centro de Desarrollos Tecnológicos, Observatorio de Yebes (IGN), 19141 Yebes, Guadalajara, Spain
3
Observatorio Astronómico Nacional (OAN, IGN), C/ Alfonso XII, 3, 28014 Madrid, Spain
4
Centro Singular de Investigación en Química Biolóxica e Materiais Moleculares (CiQUS) and Departamento de Química Orgánica, Universidade de Santiago de Compostela, 15782 Santiago de Compostela, Spain
5
Departamento de Química Física y Química Inorgánica, Facultad de Ciencias-I.U. CINQUIMA, Universidad de Valladolid, 47011 Valladolid, Spain
⋆ Corresponding author: This email address is being protected from spambots. You need JavaScript enabled to view it.
Received:
29
October
2025
Accepted:
19
November
2025
Abstract
We report the discovery of the 3- and 4-cyano isomers of acenaphthylene (C12H8) using the QUIJOTE line survey of the Taurus molecular cloud 1 (TMC-1). The frequency range of the line survey in the Q band (31.2–50.3 GHz) was complemented with data from a new receiver installed at the Yebes 40m radio telescope that covers the K and Ka bands (18–32 GHz). The identification of 3-cyanoacenaphthylene was based on the detection of 135 individual lines that correspond to 194 rotational transitions. For 4-cyanoacenaphthylene, the lines are slightly weaker, but we identified 37 individual lines that correspond to 66 rotational transitions. As a first step for the identification, we compared the derived rotational constants with their expected theoretical values and obtained a match better than 0.2%. Finally, the new isomers were synthesized in our chemical laboratory and observed in our microwave spectroscopic facilities. The derived laboratory constants match those derived from TMC-1 data perfectly, which confirms our identifications. Lines in the K − Ka band from the previously detected isomers 1- and 5-cyanoacenaphthylene are also reported. The derived column density for 3-cyanoacenaphthylene is (7.0 ± 0.7) × 1011 cm−2, and for the 4-cyano isomer, we derive a column density of (5.0 ± 0.6) × 1011 cm−2. The four possible isomers of cyanoacenaphthylene are finally found in TMC-1. Despite their high relative energies, they exhibit similar abundances (within a factor of ∼2).
Key words: astrochemistry / line: identification / molecular data / ISM: general / ISM: molecules / ISM: individual objects: TMC-1
© The Authors 2026
 Open Access article, published by EDP Sciences, under the terms of the Creative Commons Attribution License (https://creativecommons.org/licenses/by/4.0), which permits unrestricted use, distribution, and reproduction in any medium, provided the original work is properly cited.
This article is published in open access under the Subscribe to Open model. This email address is being protected from spambots. You need JavaScript enabled to view it. to support open access publication.
1. Introduction
Ultrasensitive radioastronomical line surveys are the best tool for exploring the chemical composition of interstellar and circumstellar clouds. In this context, the QUIJOTE line survey of TMC-1 (Cernicharo et al. 2021a) has provided the detection of more than 65 molecules in this cold starless dark core. Some of them are very polar species with relatively low abundances, such as the 17 S-bearing species discovered in TMC-1 (Cernicharo et al. 2021b, 2021c, 2024a; Agúfndez et al. 2025, and references therein). One of the most significant results of QUIJOTE, however, is the discovery through the standard method of a line-by-line detection of low-dipole but very abundant pure hydrocarbons such as CH2CHCCH (Cernicharo et al. 2021d), c-C6H4 (Cernicharo et al. 2021a), CH2CCHCCH (Cernicharo et al. 2021e), c-C5H6, and c-C9H8 (Cernicharo et al. 2021f), the radical H2CCCH (Agúndez et al. 2021, 2022), the long carbon chain CH2CCHC4H (Fuentetaja et al. 2022), and c-C5H5CCH2 (Cernicharo et al. 2022a). Together with some cations such as l-C3H3+ (Silva et al. 2023) and the radicals CnH, these neutrals certainly play a key role in the growth of large polycyclic aromatic hydrocarbons (PAHs) in TMC-1 (Cernicharo et al. 2022a).
Indene (c-C9H8) and phenalene (c-C13H10) are the only PAH that were directly discovered so far based on their rotational spectrum (Cernicharo et al. 2021f; Cabezas et al. 2025). The cyano derivatives of benzene and naphthalene were reported in TMC-1 using stacking techniques with the GOTHAM line survey (McGuire et al. 2018, 2021, see also Cernicharo et al. 2021g, 2024b), however. Larger species such as cyano derivatives of pyrene and corenene have also been claimed (Wenzel et al. 2024, 2025a, 2025b). Recently, the 1- and 5-cyano derivatives of acenaphthylene (two fused six-carbon and one five-carbon rings; see Fig. 1) have been reported in TMC-1 with the QUIJOTE line survey (Cernicharo et al. 2024b). New PAHs and additional isomers of previously discovered PAHs might help us to study the chemistry of these species in space.
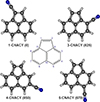 |
Fig. 1. Molecular structures of acenaphthylene (center design) and its cyano derivatives (from Cernicharo et al. 2024b). The numbers label the nitrile substitution positions of the four possible isomers of CNACY and their relative energies are given in parentheses for each isomer (in cm−1). The isomers previously detected by Cernicharo et al. (2024b) are 1- and 5-CNACY. The isomers detected in the present work are 3- and 4-CNACY. |
We present the extension of the QUIJOTE line survey to the K − Ka 18–32 GHz frequency range and the discovery of two new cyano derivatives of acenaphthylene (3- and 4- c-C12H7CN; see Fig. 1; hereafter, cyanoacenaphthylenes are referred to as CNACY). The new detections are based on 135 and 37 well-detected individual lines for 3- and 4-CNACY, respectively.
2. Observations
A significant fraction of the observational data presented in this work are part of the QUIJOTE spectral line survey in the Q band towards TMC-1(CP) (αJ2000 = 4h41m41.9s and δJ2000 = +25° 41′27.0′′) that is performed with the Yebes 40m radio telescope (Cernicharo et al. 2021a). This survey is carried out using a receiver that was built within the Nanocosmos project1. The receiver characteristics and performance were described in detail by Tercero et al. (2021). The last results of the QUIJOTE line survey have been presented by Cernicharo et al. (2024b) and correspond to a total observing time on-source of 1509.2 hours. The sensitivity varies between 0.06 mK at 32 GHz and 0.18 mK at 49.5 GHz. A detailed description of the line survey and the data analysis procedure are provided in Cernicharo et al. (2021a); Cernicharo et al. (2022a).
In addition to the Q-band observations of the QUIJOTE line survey, we present the first astronomical observations obtained with a new receiver built for the Yebes 40m radio telescope and optimised in the 18–32 GHz frequency range. The data presented here were gathered during the commissioning of the receiver. We continue to refer to the complete set of data between 18 and 50.3 GHz as the QUIJOTE line survey. The new receiver has been described in detail by López-Pérez et al. (2026). Briefly, it consists of a cryostat with a corrugated feed, an orthomode transducer (OMT) to split the linear polarisations and two cooled high-electron mobility transistor (HEMT) amplifiers covering the 18–32.3 GHz band, plus the associated room temperature amplifiers, eight dual-channel frequency downconverters, and 16 fast Fourier transform spectrometer (FFTS) boards. The instantaneous bandwidth of each FFTS board is 1GHz, resulting in a frequency resolution of 15.26 kHz. Either the 18–26 GHz or the 26–32 GHz ranges can be covered in both polarisations with 16 FFTs boards. It is also possible to cover the whole frequency range, 18–32 GHz, using the 16 FFTSs in a single polarisation. Special care was taken in the analysis of data falling in frequency ranges of strong radio frequency interferences (RFIs). While these effects were minor in the Q band, RFI in the K band is unfortunately severe and blocks a significant fraction of the electromagnetic spectrum for sensitive astronomical observations. We found for TMC-1 that these ranges are 18.00–18.30, 18.80–20.25, 22.05–22.15, 23.00–23.10, and 24.15–24.25 GHz. A detailed survey of the RFI problematic at the K − Ka band in TMC-1 and other sources is given by López-Pérez et al. (2026). The lines of a few mK can still be observed in these ranges, but the line intensities and baselines can be strongly affected by RFI.
The observations in the K band were taken with different local oscillator frequencies to avoid ghost signals that might be produced in the down-conversion chain. The observing procedure and the data analysis are similar to that used in the Q band (Cernicharo et al. 2021a, 2022a), that is, frequency switching with two different throws. A total of 226 hours of observing time on-source were accomplished in the 18–26 GHz range. This observing time corresponds to five local oscillator frequency settings. The sensitivity was ∼0.2–0.4 mK when the H & V polarisations were averaged. In the 26–32 GHz domain, the observing time was only 80 hours, which provides a H+V sensitivity of ∼0.6–0.8 mK across the band. Most of the reported line detections in this work are therefore within the 18–26 GHz range.
Telescope main-beam and forward efficiencies in Q/K bands were given by Tercero et al. (2021) and López-Pérez et al. (2026), respectively. The telescope beam size at half-power intensity is given by HPBW(′′) = 1763/ν, where ν is the frequency in gigahertz. The adopted intensity scale is the antenna temperature (TA*). The absolute calibration uncertainty is 10%. All the data were analysed with the GILDAS package2.
Molecular constants of the two new isomers of CNACY (A reduction and Ir representation).
3. Results
We identified all lines using the code MADEX (Cernicharo 2012) in addition to the CDMS and JPL catalogues (Müller et al. 2005; Pickett et al. 1998). We assumed a velocity for the source relative to the local standard of rest of 5.83 km s−1 (Cernicharo et al. 2020). In the K band, the lines of all isotopologues of HC3N, HC5N, HC7N, C3N, C4H, and C6H are easily detected, together with the rotational lines of species such as C6H5CN, HC5NH+ and HC7NH+, which are about a few mK (see some preliminary results in López-Pérez et al. 2026). These lines were observed with a high signal-to-noise ratio (S/N).
It is surprising to see that after these lines were identified, many of the strongest remaining features arose from the recently detected isomers 1- and 5- of cyanoacenaphthylene (CNACY; Cernicharo et al. 2024b). The four possible isomers of cyanoacenaphthylene are depicted in Fig. 1. In view of the observed intensities in the K band of the 1- and 5-CNACY isomers, the two other isomers 3- and 4-CNACY might very likely also be present in the data. Their expected rotational constants have been previously calculated (Cernicharo et al. 2024b) and are given in Table 1. The spectra of the two species are expected to be dominated by a-type transitions (see Table 1). Similar to the case of the isomers 1- and 5-, we expect for 3- and 4-CNACY that the J′Ka, J′-J′′Ka, J′′ transitions (J′′ = J′-1; R transitions) with Ka=0,1 are in harmonic relation with J′+1/2 (half-integer numbers) and not with J′ (Cernicharo et al. 2024b). Moreover, the fitted rotational constant might practically be the rotational constant C (Cernicharo et al. 2024b). We searched in the Q band and found a few weak but well-detected lines (see Fig. 2) that we were able to reproduce with a rotational constant of 431.25 MHz. This value agrees excellently well with the expected value of C for 3-cyanoacenaphthylene (see Table 1). After some trial and error procedure, we were able to find tens of lines with Ka up to 9. In addition, lines in the K band were also found and provided a total of 194 rotational transitions with 135 independent frequencies. The derived rotational and distortion constants are given in Table 1. The line parameters are given in Table A.1, and selected lines are shown in Fig. 2.
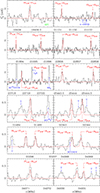 |
Fig. 2. Selected lines of the isomer 3-CNACY observed in the K and Q bands. The abscissa is the rest frequency in MHz adopting a VLSR for the source of 5.83 km s−1 (Cernicharo et al. 2020). The ordinate is the antenna temperature corrected for atmospheric losses in mK (same scale for all panels). The labels α, β, and γ correspond to unresolved doublets with Ka = 0,1, Ka = 1,2, and Ka = 2,3, respectively. The red line corresponds to the synthetic spectrum computed with the physical parameters discussed in the text. |
For the isomer 4-CNACY, the search was more complex because the lines are weak. Nevertheless, 15 pairs of Ka = 0,1 lines were found in the K and Q bands. These lines were complemented with resolved and unresolved Ka = 1,2 and 3,4 transitions, which provided a total of 66 rotational transitions and 37 individual frequencies (see Table A.2). The derived rotational constants are given in Table 1, and selected lines are shown in Fig. A.1.
The two new isomers were synthesised in the laboratory (see Appendix B) and observed through microwave spectroscopy experiments (see Appendix C). The derived rotational constants perfectly match those obtained from the TMC-1 data, as shown in Table 1. In addition to the previously detected lines in the Q band for 1-CNACY, a total of 82 new rotational transitions corresponding to 51 independent frequencies were observed for this isomer. Selected lines are shown in Fig. A.2. The observed and calculated frequencies are given in Table A.3. For the isomer 5-CNACY, we observed 54 new rotational transitions, which corresponds to 31 independent frequencies. They are given in Table A.4. Selected lines are shown in Fig. A.3.
New rotational constants for 1- and 5-CNACY were derived using the lines observed in the K band and those previously observed in the Q band and in the laboratory (Cernicharo et al. 2024b). They are given in Table A.5.
4. Discussion
Column densities for 1- and 5-CNACY were obtained for the previously observed lines of these isomers in the Q band (Cernicharo et al. 2024b). The telescope parameters and source properties were used to model the emission of the different species to produce synthetic spectra on the TA* temperature scale. We assumed that these species are close to thermalisation, TK = 9 K, and that the source can be simplified as a disc with a uniform brightness temperature of 80′′ in diameter (Fossé et al. 2001; Cernicharo et al. 2023; Fuentetaja et al. 2025). A line width of 0.5 km s−1 was adopted. With these assumptions, we confirmed the same column density as was derived previously for both isomers, that is, (9.5 ± 0.5) × 1011 cm−2. The predicted line profiles for the lines of 1- and 5-CNACY in the K band are shown as red lines in figures A.2 and A.3. As for the Q band (Cernicharo et al. 2024b), the data in the K band and the model agree very well for the two isomers.
For 3-CNACY, our data suggest that for a common angular size, a slightly different rotational temperature is required for low- and high-J lines (K and Q band). For a column density of (7.0 ± 0.7) × 1011 cm−2, we found that a rotational temperature of 9 K fits all lines in the K band well. Although the intensity of individual lines in the Q band is reproduced within 30% by this model, however, we found that all together are slightly better fitted with Trot = 7.5 K. The computed line profiles for selected lines of 3-CNACY in the K and Q bands are shown by the red lines in Fig. 2. The data and model agree very well. We also found that within the Q band, the line intensities tend to decrease as J and Ka increase. We lack collisional rates for the isomers of cyanoacenapthylene and therefore cannot evaluate the effect of collisional excitation on the rotational temperatures of the observed lines. For 4-CNACY, we adopted a rotational temperature of 9 K (see Appendix A), and we derived a column density of (5.0 ± 0.6) × 1011 cm−2. This shows that the 1- and 5-CNACY are the most abundant isomers with a similar column density, while 3-CNACY and 4-CNACY are 1.3 and 1.9 times less abundant, respectively. This behaviour for the abundances of cyano derivatives of abundant species, with similar abundances for all isomers (within a factor of ∼2), has been found for the five possible isomers of cyanopropenes (Cernicharo et al. 2022b), for which the relative energies span more than 1600 cm−1. The derived total abundance for the isomers of cyanoacenaphthylene (3.1 × 1012 cm−2) are therefore ∼1.8 more abundant than those of cyanonaphthalenes (McGuire et al. 2021, see the most recent determination by Cernicharo et al. 2024b) and ∼2 times more abundant than cyanopyrenes (Wenzel et al. 2024, 2025a). As already pointed out in our previous works, this result suggests that larger PAHs in TMC-1 might either be a mix of 5- and 6-carbon rings, such as acepnaphthylene, or pure benzenic rings, such as pyrene and coronene.
As discussed by Cernicharo et al. (2024b) and Cabezas et al. (2025), and taking into account the fact that the spatial distribution of benzonitrile is identical to that of cyanopolyynes and other molecular species (Cernicharo et al. 2023), we considered that a bottom-up process is at work in the formation of PAHs in cold dark clouds. The detailed chemical routes for the growth of PAHs are still unknown, however. The high abundances we found for all these PAHs clearly show that some still missing reactions between neutral, cations, and radicals have to be involved in their production if a bottom-up scheme is at work in TMC-1.
5. Conclusions
We described a new dataset between 18 and 32 GHz for the QUIJOTE line survey using the new receiver in the K band that was installed at the 40m Yebes radio telescope. Based on these data, we reported the detection of two new isomers of cyanoacenaphthylene (3- and 4- c-C12H7CN). The column densities of the 4-cyanide isomers of this PAH are similar within a factor of two, despite the large energy difference between them (see Fig. 1). This shows that kinetic effects and not energetic principles dominate the chemistry of the cyano derivatives of hydrocarbons in TMC-1. An important result of our work related to the future modelling of K- and Q-band data is that we found that the column densities and source parameters derived from the isomer lines of cyanoacenaphthylene in these bands can be fitted with the same physical parameters. Nevertheless, some fine-tuning of Trot is needed for 3-CNACY. This means that collisional rates are needed to correctly model the lines of these species.
Data availability
Data underlying this article are available on Zenodo repository (https://doi.org/10.5281/zenodo.15166605). The data comprise the full Tables A.1, A.2, A.3, A.4, C.1 and together with extra details on the synthesis of cyanoacenaphthylene isomers.
Acknowledgments
This work was based on observations carried out with the Yebes 40m telescope (projects 19A003, 20A014, 20D023, 21A011, 21D005, 23A024 and commissioning observations for the new ASTROREC receiver). The 40m radiotelescope at Yebes Observatory is operated by the IGN, Ministerio de Transportes y Movilidad Sostenible. We thank Spanish Ministerio de Ciencia e Innovación and the European Regional Development Fund (MICINN–ERDF) for funding support through projects PID2019-106110GB-I00, PID2019-106235GB-I00, PID2021-125015NB-I00, PID2022-139933NB-I00, PID2022-137980NB-I00, PID2023-147545NB-I00, and PID2024-158277NB-I00. We also thank ERC for funding through grant ERC-2013-Syg-610256-NANOCOSMOS and CoG-101124939-HydroChiral. CL and DP thank financial support from the Xunta de Galicia (Centro de investigación do Sistema universitario de Galicia accreditation 2023-2027, ED431G 2023/03).
References
- Agúfndez, M., Molpeceres, G., Cabezas, C., et al. 2025, A&A, 693, L20 [NASA ADS] [CrossRef] [EDP Sciences] [Google Scholar]
- Agúndez, M., Cabezas, C., Tercero, B., et al. 2021, A&A, 647, L10 [EDP Sciences] [Google Scholar]
- Agúndez, M., Marcelino, N., Cabezas, C., et al. 2022, A&A, 657, A96 [NASA ADS] [CrossRef] [EDP Sciences] [Google Scholar]
- Cabezas, C., Agúndez, M., Pérez, C., et al. 2025, A&A, 701, L8 [NASA ADS] [CrossRef] [EDP Sciences] [Google Scholar]
- Cernicharo, J. 2012, in ECLA 2011: Proc. of the ECLA 2011, eds. C. Stehl, C. Joblin, & L. d’Hendecourt, EAS Pub. Ser., 251 [Google Scholar]
- Cernicharo, J., Marcelino, N., Agúndez, M., et al. 2020, A&A, 642, L8 [NASA ADS] [CrossRef] [EDP Sciences] [Google Scholar]
- Cernicharo, J., Agúndez, M., Kaiser, R., et al. 2021a, A&A, 652, L9 [NASA ADS] [CrossRef] [EDP Sciences] [Google Scholar]
- Cernicharo, J., Cabezas, C., Agúndez, M., et al. 2021b, A&A, 648, L3 [EDP Sciences] [Google Scholar]
- Cernicharo, J., Cabezas, C., Endo, Y., et al. 2021c, A&A, 646, L3 [EDP Sciences] [Google Scholar]
- Cernicharo, J., Agúndez, M., Cabezas, C., et al. 2021d, A&A, 647, L2 [EDP Sciences] [Google Scholar]
- Cernicharo, J., Cabezas, C., Agúndez, M., et al. 2021e, A&A, 647, L3 [EDP Sciences] [Google Scholar]
- Cernicharo, J., Agúndez, M., Cabezas, C., et al. 2021f, A&A, 649, L15 [EDP Sciences] [Google Scholar]
- Cernicharo, J., Agúndez, M., Kaiser, R. I., et al. 2021g, A&A, 655, L1 [NASA ADS] [CrossRef] [EDP Sciences] [Google Scholar]
- Cernicharo, J., Fuentetaja, R., Agúndez, M., et al. 2022a, A&A, 663, L9 [NASA ADS] [CrossRef] [EDP Sciences] [Google Scholar]
- Cernicharo, J., Fuentetaja, R., Cabezas, C., et al. 2022b, A&A, 663, L5 [NASA ADS] [CrossRef] [EDP Sciences] [Google Scholar]
- Cernicharo, J., Tercero, B., Marcelino, N., et al. 2023, A&A, 674, L4 [NASA ADS] [CrossRef] [EDP Sciences] [Google Scholar]
- Cernicharo, J., Agúndez, M., Cabezas, C., et al. 2024a, A&A, 682, L4 [NASA ADS] [CrossRef] [EDP Sciences] [Google Scholar]
- Cernicharo, J., Cabezas, C., Fuentetaja, R., et al. 2024b, A&A, 690, L13 [NASA ADS] [CrossRef] [EDP Sciences] [Google Scholar]
- Fossé, D., Cernicharo, J., Gerin, M., & Cox, P. 2001, ApJ, 552, 168 [Google Scholar]
- Fuentetaja, R., Cabezas, C., Agúndez, M., et al. 2022, A&A, 663, L3 [NASA ADS] [CrossRef] [EDP Sciences] [Google Scholar]
- Fuentetaja, R., Cabezas, C., Endo, Y., et al. 2025, A&A, 702, A23 [NASA ADS] [CrossRef] [EDP Sciences] [Google Scholar]
- López-Pérez, J. A., Tercero, F., Gallego-Puyol, J. D., et al. 2026, A&A, 705, A17 [NASA ADS] [CrossRef] [EDP Sciences] [Google Scholar]
- McGuire, B. A., Burkhardt, A. M., Kalenskii, S., et al. 2018, Science, 359, 202 [Google Scholar]
- McGuire, B. A., Loomis, R. A., Burkhardt, A. M., et al. 2021, Science, 371, 1265 [Google Scholar]
- Müller, H. S. P., Schlöder, F., Stutzki, J., & Winnewisser, G. 2005, J. Mol. Struct., 742, 215 [Google Scholar]
- Pérez, C., Lobsiger, S., Seifert, N. A., et al. 2013, Chem. Phys. Lett., 571, 1 [NASA ADS] [CrossRef] [Google Scholar]
- Pickett, H. M. 1991, J. Mol. Spectrosc., 148, 371 [Google Scholar]
- Pickett, H. M., Poynter, R. L., Cohen, E. A., et al. 1998, J. Quant. Spectrosc. Radiat. Transfer, 60, 883 [Google Scholar]
- Silva, W. G. D. P., Cernicharo, J., Schlemmer, S., et al. 2023, A&A, 676, L1 [NASA ADS] [CrossRef] [EDP Sciences] [Google Scholar]
- Tercero, F., López-Pérez, J. A., Gallego, J. D., et al. 2021, A&A, 645, A37 [EDP Sciences] [Google Scholar]
- Watson, J. K. G. 1977, in Vibration Spectra and Structure, ed. J. Durig (Amsterdam: Elsevier), 6, 1 [Google Scholar]
- Wenzel, G., Cooke, I. R., Changala, P. B., et al. 2024, Science, 386, 810 [NASA ADS] [CrossRef] [Google Scholar]
- Wenzel, G., Speak, T. H., Changala, P. B., et al. 2025a, Nat. Astron, 9, 262 [Google Scholar]
- Wenzel, G., Gong, S., Xue, C., et al. 2025b, ApJ, 984, L36 [Google Scholar]
Appendix A: Observed frequencies for the isomers of cyanoacenaphthylene
Line frequencies for all observed transitions with the Yebes 40m radio telescope were derived by fitting a Gaussian line profile to them using the GILDAS package. A velocity range of ±20 km s−1 around each feature was considered for the fit after a polynomial baseline was removed. Negative features produced in the folding of the frequency switching data were blanked before baseline removal.
Frequencies in the K- and Q-bands for 3-CNACY and 4-CNACY (see Fig. 1) are given in Tables A.1, and A.2, respectively. Selected lines of 3-CNACY and 4-CNACY are shown in Figures 2 and A.1, respectively. The derived rotational constants for these two isomers in space and in the laboratory are given in Table 1.
In Sect. 4 we have assumed a single rotational temperature of 9 K for 4-CNACY. From Fig. A.1 it appears that some of the high-J lines could be somewhat better fitted with a lower rotational temperature as it was the case for 3-CNACY. However, the signal to noise ratio is not as good for 4-CNACY and the number of observed lines is lower. Hence, a single rotational temperature reproduces, within the S/N of the data, the observed line intensities. Collisional rates for the four isomers are needed to model correctly their level population and their line intensities.
Frequencies for 1-CNACY and 5-CNACY in the K-band are given in Tables A.3 and A.4 respectively. Selected lines in the K-band for these two isomers are shown in Figures A.2 and A.3, respectively. Frequencies in the Q-band for these isomers are those already provided by Cernicharo et al. (2024b). New rotational constants from all lines in space and in the laboratory of 1- and 5-CNACY are given in Table A.5.
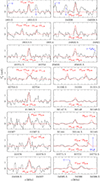 |
Fig. A.1. Same as Fig. 2 but for selected lines of the isomer 4-CNACY. The physical parameters used for the calculation of the synthetic spectra are discussed in the text. The quantum numbers are indicated in red for each transition in each panel. |
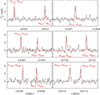 |
Fig. A.2. Same as Fig. 2 but for selected lines in the K-band of the isomer 1-CNACY. The molecule has been previously observed in the Q-band (Cernicharo et al. 2024b).The physical parameters used for the calculation of the synthetic spectra are discussed in the text. |
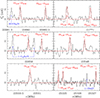 |
Fig. A.3. Same as Fig. 2 but for selected lines in the K-band of the isomer 5-CNACY. The molecule has been previously observed in the Q-band (Cernicharo et al. 2024b). The physical parameters used for the calculation of the synthetic spectra are discussed in the text. |
Observed transition frequencies and line parameters for 3-CNACY* in TMC-1.
Observed transition frequencies and line parameters for 4-CNACY* in TMC-1.
Appendix B: Synthesis of cyanoacenaphthylene isomers
3-Cyanoacenaphthylene (3-CNACY) and 4-cyanoacenaphthylene (4-CNACY) were prepared through multistep synthetic routes, starting from commercially available acenaphthene, as described in detail in https://doi.org/10.5281/zenodo.15166605. Thus, nitration of acenaphthene at positions C-3 and C-5, followed by reduction of the nitro groups afforded a mixture of 3-amino- and 5-aminoacenaphthene in 1:4 ratio, which was used in both synthetic procedures. On the one hand, a Sandmeyer reaction with CuBr gave a mixture of 3-bromo- and 5-bromoacenaphthenes, which was subjected to cyanodebromination with CuCN and subsequent oxidation with DDQ to afford 3-CNACY as a –difficult to separate– 1:1 mixture with 5-CNACY. Analytical samples of pure 3-CNACY were isolated after repeated column chromatography, allowing its unambiguous characterisation. On the other hand, bromination of the mixture of 3- and 5-aminoacenaphthenes occurred selectivity at position C-4, providing the required functionalisation to obtain 4-CNACY, after three further synthetic steps (see https://doi.org/10.5281/zenodo.15166605 for details).
Observed transition frequencies in the K-band for 1-CNACY* in TMC-1.
Observed transition frequencies in the K-band for 5-CNACY* in TMC-1.
Appendix C: CP-FTMW spectral measurements
The experimental setup employed to measure the rotational spectra of 3-CNACY and 4-CNACY consists of broadband chirped-pulse Fourier-transform microwave (CPFTMW) spectrometer working from 2-18 GHz. The design is largely based on the original design by Pérez et al. (2013) with some modifications to allow for direct excitation-detection of the whole 16 GHz bandwidth. The excitation pulse, ranging from 1 to 9 GHz, is directly generated using an arbitrary waveform generator (Tektronix AWG 70002A, 25 GS/s). This pulse is pre-amplified and frequency-doubled to produce a 4 μs pulse within the 2-18 GHz range. Subsequently, the pulse is amplified using a solid-state amplifier (SSA Qorvo QPB0220N, 54 dBm output power) that operates over the entire frequency range. The samples of 4-CNACY and a mixture containing 3-CNACY (see synthetic methods for more description) were placed in a reservoir near the valve orifice and heated to 120°C to generate sufficient vapor pressure. These samples were then seeded into a supersonic expansion by mixing with neon before being expanded into a vacuum chamber. This process facilitated efficient ro-vibrational cooling, simplifying the rotational spectrum and enhancing its intensity. The gas ensemble interacted with the amplified chirped excitation pulse, inducing a macroscopic dipole moment in all polar species within the pulse. The molecular emission was amplified by a 2-18 GHz low-noise amplifier (Miteq LNAS-55-01001800-22-10P) and collected in the time domain as a free-induction decay using a fast oscilloscope (Tektronix DPO 73304DX, 100 GS/s). The recorded waveform was then Fourier-transformed to obtain the final frequency-domain spectrum.
Molecular constants of the 1-CNACY and 5-CNACY isomers derived in this work (A-reduction and Ir representation) from laboratory and TMC-1 data.
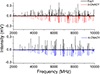 |
Fig. C.1. Broadband microwave spectra of 3-CNACY and 4-CNACY in the region 2-10 GHz. The experimental trace is represented by the positive black trace. The negative red and blue traces are simulations (at 2 K) using the fitted rotational parameters of Table 1. |
The 3-CNACY and 4-CNACY isomers have high μa dipole moment components, 5.1 D and 5.3 D respectively. In addition, 3-CNACY species shows a μb dipole moment of 1.1 D. A rich rotational spectrum is therefore observed for both isomers (see Fig. C.1). The presence in the CNACY isomers of a 14N-nitrogen nucleus, which has a nonzero nuclear spin (I = 1), causes each rotational transition to be split into several hyperfine components because of the nuclear quadrupole coupling effects. Therefore, the final dataset for the 3-CNACY isomer consists of 572 hyperfine components corresponding to a- and b-type rotational transitions while for 4-CNACY, we measured a total of 488 hyperfine components of a-type transitions. All the observed hyperfine components were fitted using the SPFIT program (Pickett 1991) with the A-reduction of the Watson’s Hamiltonian and IIIl representation (Watson 1977), as we did for 1- and 5-CNACY. A combined fit of the laboratory and TMC-1 data for each isomer provides improved values for the molecular parameters. A summary of all the obtained results is shown in Table 1 while all the measured transitions for 3-CNACY and 4-CNACY isomers are given in Tables C.1 and 6. The experimental molecular constants for both isomers agree very well with those obtained by quantum chemical calculations at B3LYP/6-311++G(d,p) level of theory, as can be seen in Table 1.
Laboratory-observed transition frequencies for 3-CNACY*.
Laboratory-observed transition frequencies for 4-CNACY*.
All Tables
Molecular constants of the two new isomers of CNACY (A reduction and Ir representation).
Molecular constants of the 1-CNACY and 5-CNACY isomers derived in this work (A-reduction and Ir representation) from laboratory and TMC-1 data.
All Figures
|
Fig. 1. Molecular structures of acenaphthylene (center design) and its cyano derivatives (from Cernicharo et al. 2024b). The numbers label the nitrile substitution positions of the four possible isomers of CNACY and their relative energies are given in parentheses for each isomer (in cm−1). The isomers previously detected by Cernicharo et al. (2024b) are 1- and 5-CNACY. The isomers detected in the present work are 3- and 4-CNACY. |
| In the text | |
|
Fig. 2. Selected lines of the isomer 3-CNACY observed in the K and Q bands. The abscissa is the rest frequency in MHz adopting a VLSR for the source of 5.83 km s−1 (Cernicharo et al. 2020). The ordinate is the antenna temperature corrected for atmospheric losses in mK (same scale for all panels). The labels α, β, and γ correspond to unresolved doublets with Ka = 0,1, Ka = 1,2, and Ka = 2,3, respectively. The red line corresponds to the synthetic spectrum computed with the physical parameters discussed in the text. |
| In the text | |
|
Fig. A.1. Same as Fig. 2 but for selected lines of the isomer 4-CNACY. The physical parameters used for the calculation of the synthetic spectra are discussed in the text. The quantum numbers are indicated in red for each transition in each panel. |
| In the text | |
|
Fig. A.2. Same as Fig. 2 but for selected lines in the K-band of the isomer 1-CNACY. The molecule has been previously observed in the Q-band (Cernicharo et al. 2024b).The physical parameters used for the calculation of the synthetic spectra are discussed in the text. |
| In the text | |
|
Fig. A.3. Same as Fig. 2 but for selected lines in the K-band of the isomer 5-CNACY. The molecule has been previously observed in the Q-band (Cernicharo et al. 2024b). The physical parameters used for the calculation of the synthetic spectra are discussed in the text. |
| In the text | |
|
Fig. C.1. Broadband microwave spectra of 3-CNACY and 4-CNACY in the region 2-10 GHz. The experimental trace is represented by the positive black trace. The negative red and blue traces are simulations (at 2 K) using the fitted rotational parameters of Table 1. |
| In the text | |
Current usage metrics show cumulative count of Article Views (full-text article views including HTML views, PDF and ePub downloads, according to the available data) and Abstracts Views on Vision4Press platform.
Data correspond to usage on the plateform after 2015. The current usage metrics is available 48-96 hours after online publication and is updated daily on week days.
Initial download of the metrics may take a while.