Fig. 3
Download original image
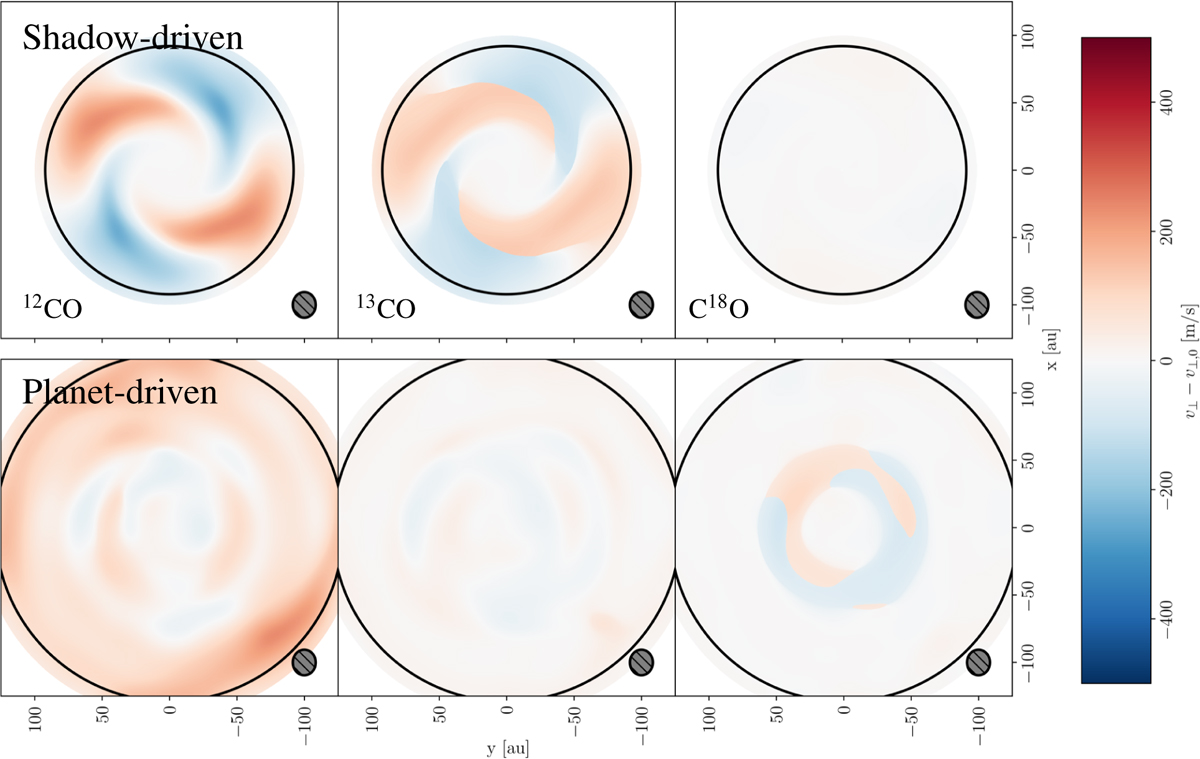
Kinematic moment-1 (line-of-sight velocity) maps at the end of the simulation, with moment-1 from the initial condition subtracted, as in Fig. 2. In contrast to the plots in Fig. 2, we fix the disk inclination to 0◦ (face-on) and plot (from left to right) the maps corresponding to the J = 2 − 1 transitions of the 12CO , 13CO , and C18O isotopologues, which respectively trace the upper, intermediate, and midplane layers of the disk. In C18O, the two-armed signature of the shadow-driven spiral is virtually absent, but for the standard planet-driven case the inner Lindlbad spirals remain visible.
Current usage metrics show cumulative count of Article Views (full-text article views including HTML views, PDF and ePub downloads, according to the available data) and Abstracts Views on Vision4Press platform.
Data correspond to usage on the plateform after 2015. The current usage metrics is available 48-96 hours after online publication and is updated daily on week days.
Initial download of the metrics may take a while.