Fig. 6
Download original image
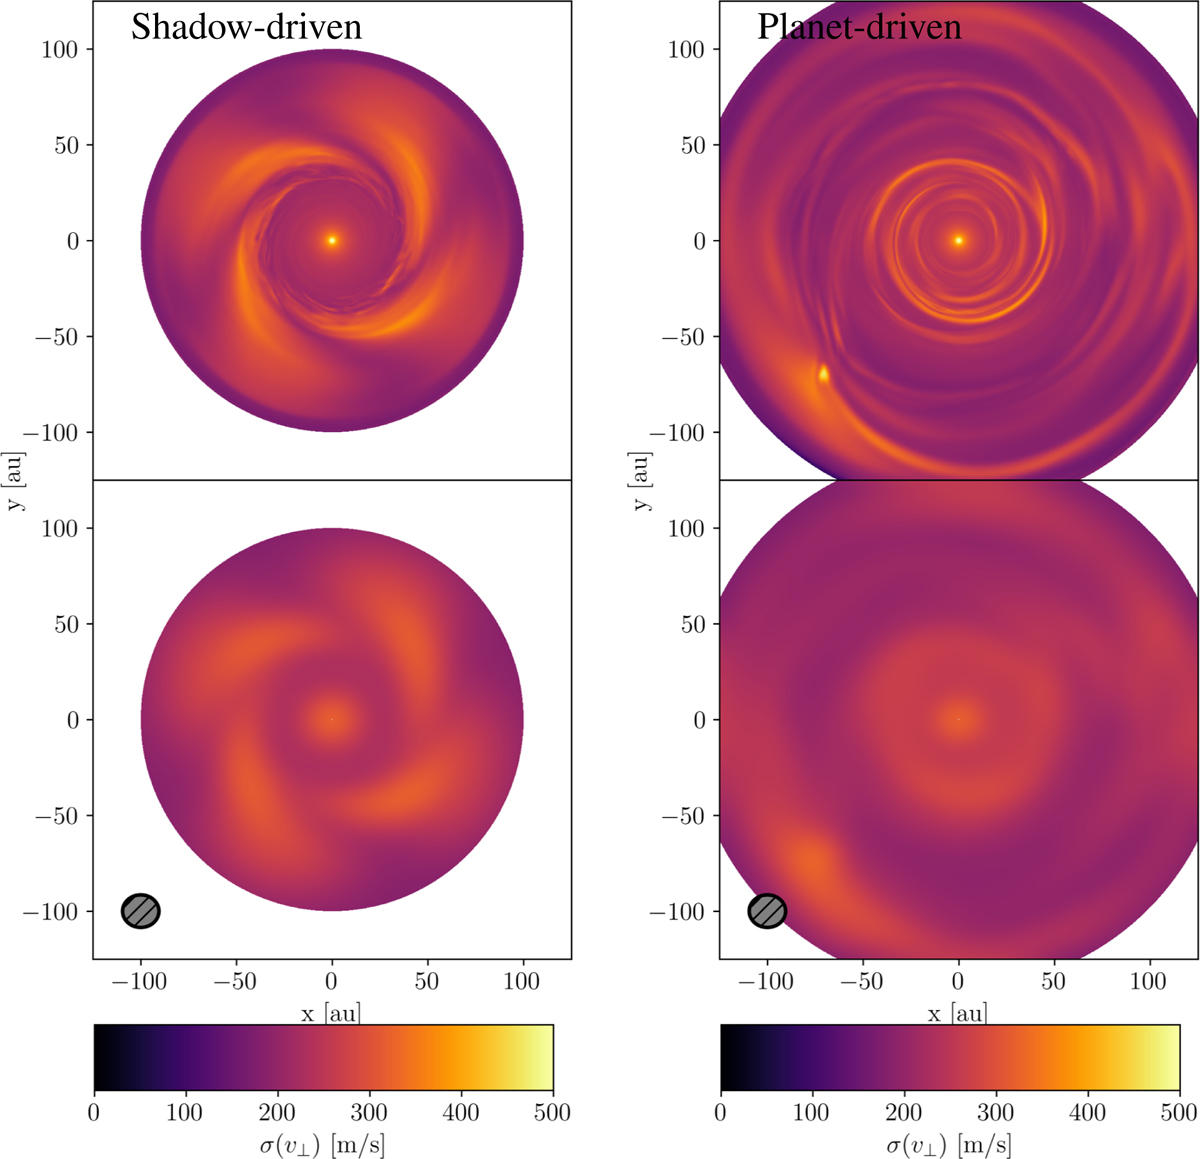
Maps of the typical line-of-sight velocity dispersion along each line of sight in the J = 2 − 1 transition of 12CO, for the shadow-driven case (left) and the planet-driven case (right). The upper panels are computed from the raw datacubes, while the lower panels are computed from the datacubes convolved with the fiducial beam. In the planet-driven case, we see a strong localized increase in velocity dispersion near the planet location, and in the interior of the disk; in the shadow-driven case we see four separate peaks along the outer edge of the gap, corresponding to the launching points of the spirals.
Current usage metrics show cumulative count of Article Views (full-text article views including HTML views, PDF and ePub downloads, according to the available data) and Abstracts Views on Vision4Press platform.
Data correspond to usage on the plateform after 2015. The current usage metrics is available 48-96 hours after online publication and is updated daily on week days.
Initial download of the metrics may take a while.