Fig. 8
Download original image
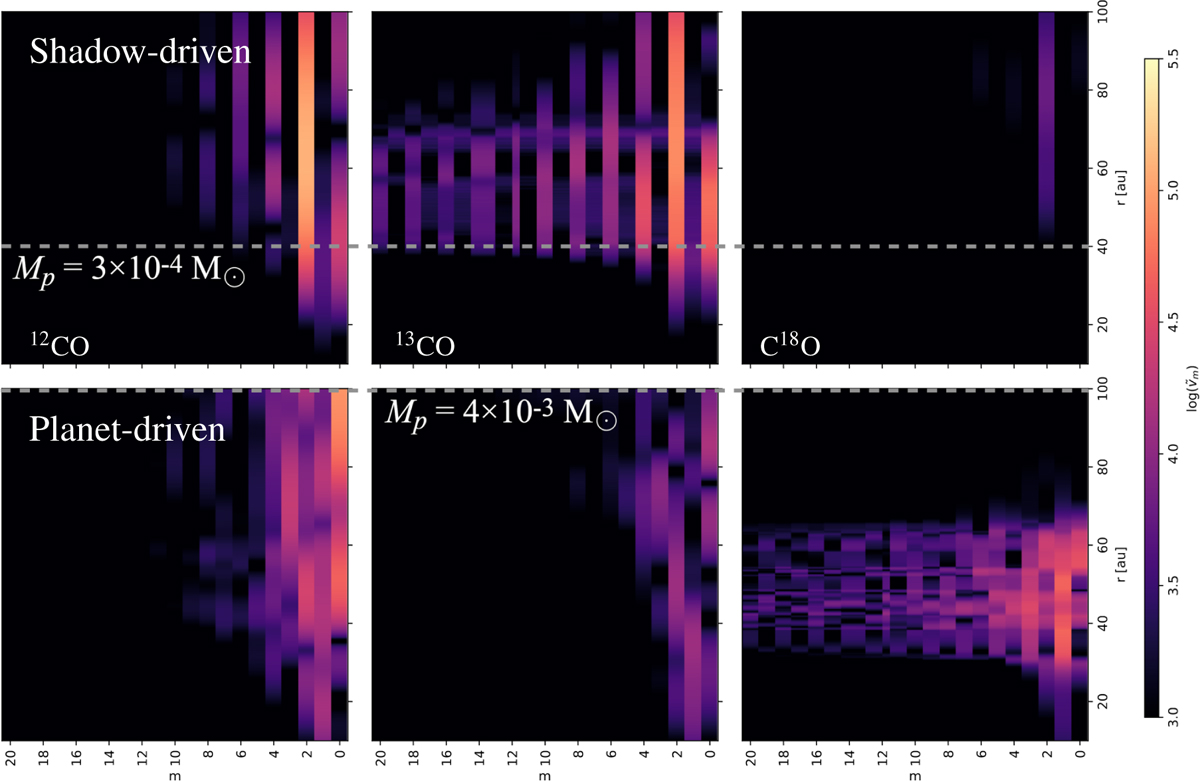
Modal plots for moment-1 maps constructed from beam-convolved datacubes. From left to right, we show modal plots associated with the J = 2 − 1 transitions of 12CO, 13CO, and C18O, respectively, fixing the inclination to 0◦. We indicate the planet’s radial location in each case with a dotted line. As in Fig. 7, the shadow-driven case is above, while the planet-driven case is below. Shadow-driven spirals show an m = 2 mode steadily decreasing in strength with deeper and deeper isotopologues.
Current usage metrics show cumulative count of Article Views (full-text article views including HTML views, PDF and ePub downloads, according to the available data) and Abstracts Views on Vision4Press platform.
Data correspond to usage on the plateform after 2015. The current usage metrics is available 48-96 hours after online publication and is updated daily on week days.
Initial download of the metrics may take a while.