Fig. A.8
Download original image
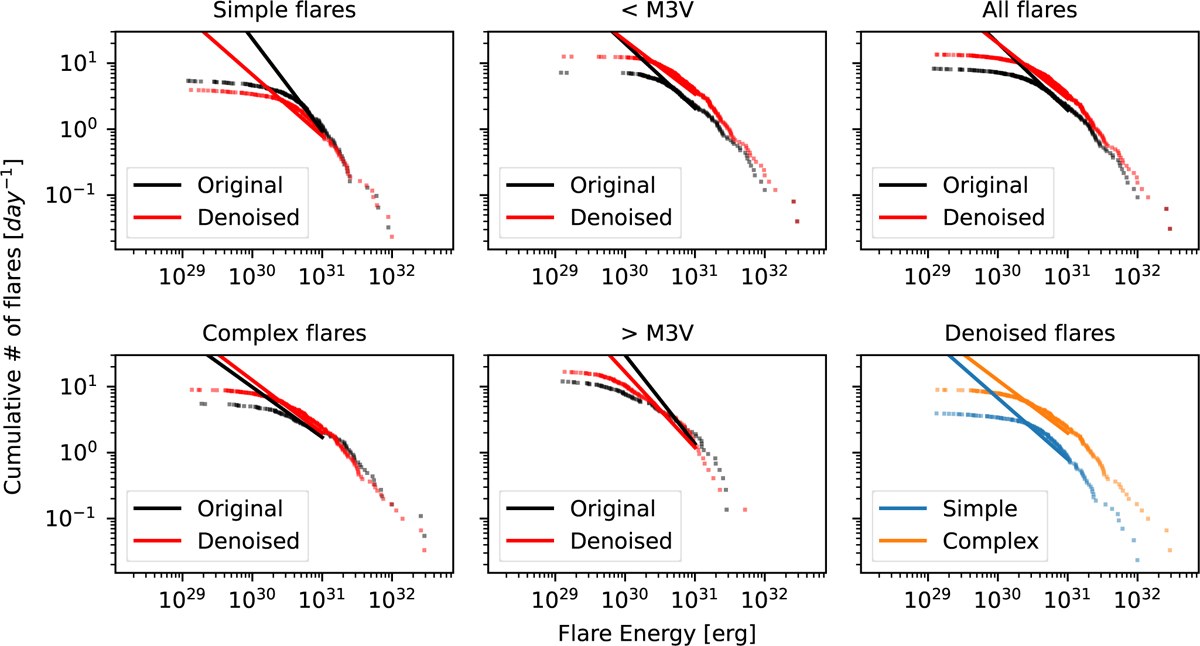
Flare frequency distributions for the flares recovered in our original (black) and denoised (red) samples. The FFDs are separated into simple flares (top left), individual components of complex flares (bottom left), flares on partially convective stars (top middle), flares on fully convective stars (bottom middle), and the full flare samples (top right). Bottom right: Comparison between the simple flares (blue) and individual complex flare components (orange) recovered from the denoised light curves (bottom right). The solid lines indicate linear fits to the double-logarithmic FFD, extrapolated into regimes not directly observed.
Current usage metrics show cumulative count of Article Views (full-text article views including HTML views, PDF and ePub downloads, according to the available data) and Abstracts Views on Vision4Press platform.
Data correspond to usage on the plateform after 2015. The current usage metrics is available 48-96 hours after online publication and is updated daily on week days.
Initial download of the metrics may take a while.