Fig. 12.
Download original image
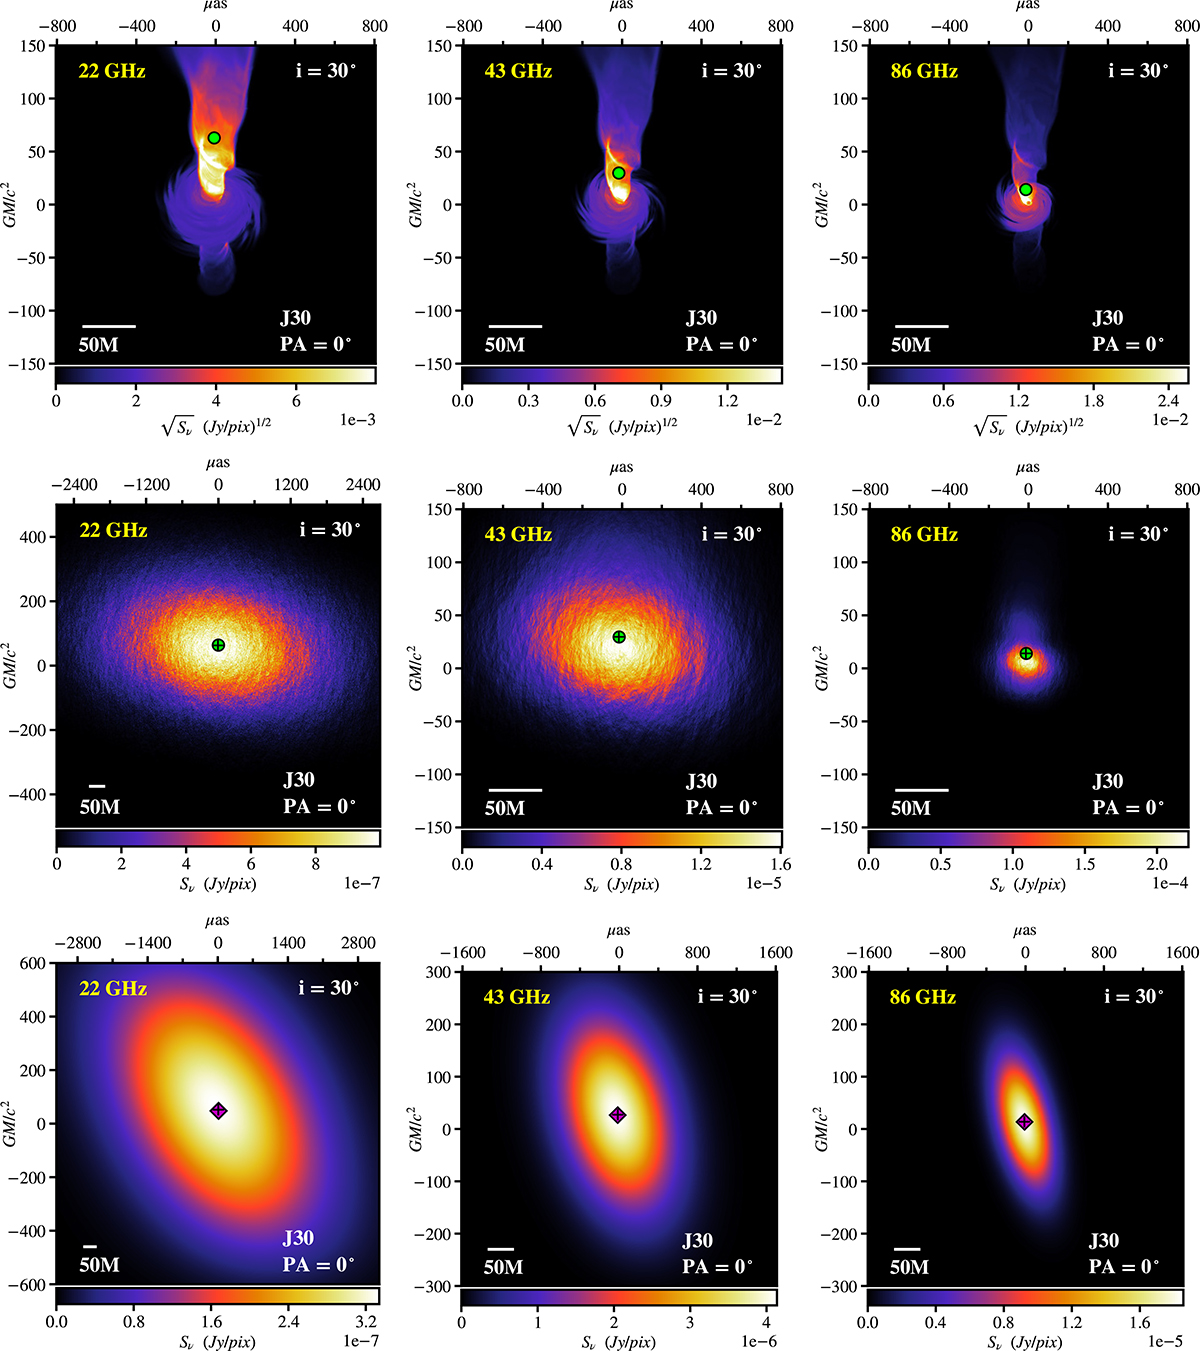
Jet model (J30) including scattering as observed by the VLBA. Each column shows a jet model with inclination i = 30° at 22 GHz, 43 GHz, and 86 GHz (left to right). The position angle on the sky is PA = 0°. Rows from top to bottom show the intrinsic 3D-GRMHD jet model, the jet model with scatter-broadening plus refractive scattering, and at the bottom the observed jet. Note that for images at 22 GHz (left column), and the observed jets at all frequencies have a larger FOV. The color stretch is also different. The intrinsic model panels display the square-root of the flux density (top row). The scattered and observed maps show a linear scale (second and third rows). The green dot indicates the centroid of the unobserved models (first and second rows). The purple diamond indicates the centroid of the observed models (third row). Black cross-hairs indicate the location of the centroid of all models before scattering.
Current usage metrics show cumulative count of Article Views (full-text article views including HTML views, PDF and ePub downloads, according to the available data) and Abstracts Views on Vision4Press platform.
Data correspond to usage on the plateform after 2015. The current usage metrics is available 48-96 hours after online publication and is updated daily on week days.
Initial download of the metrics may take a while.