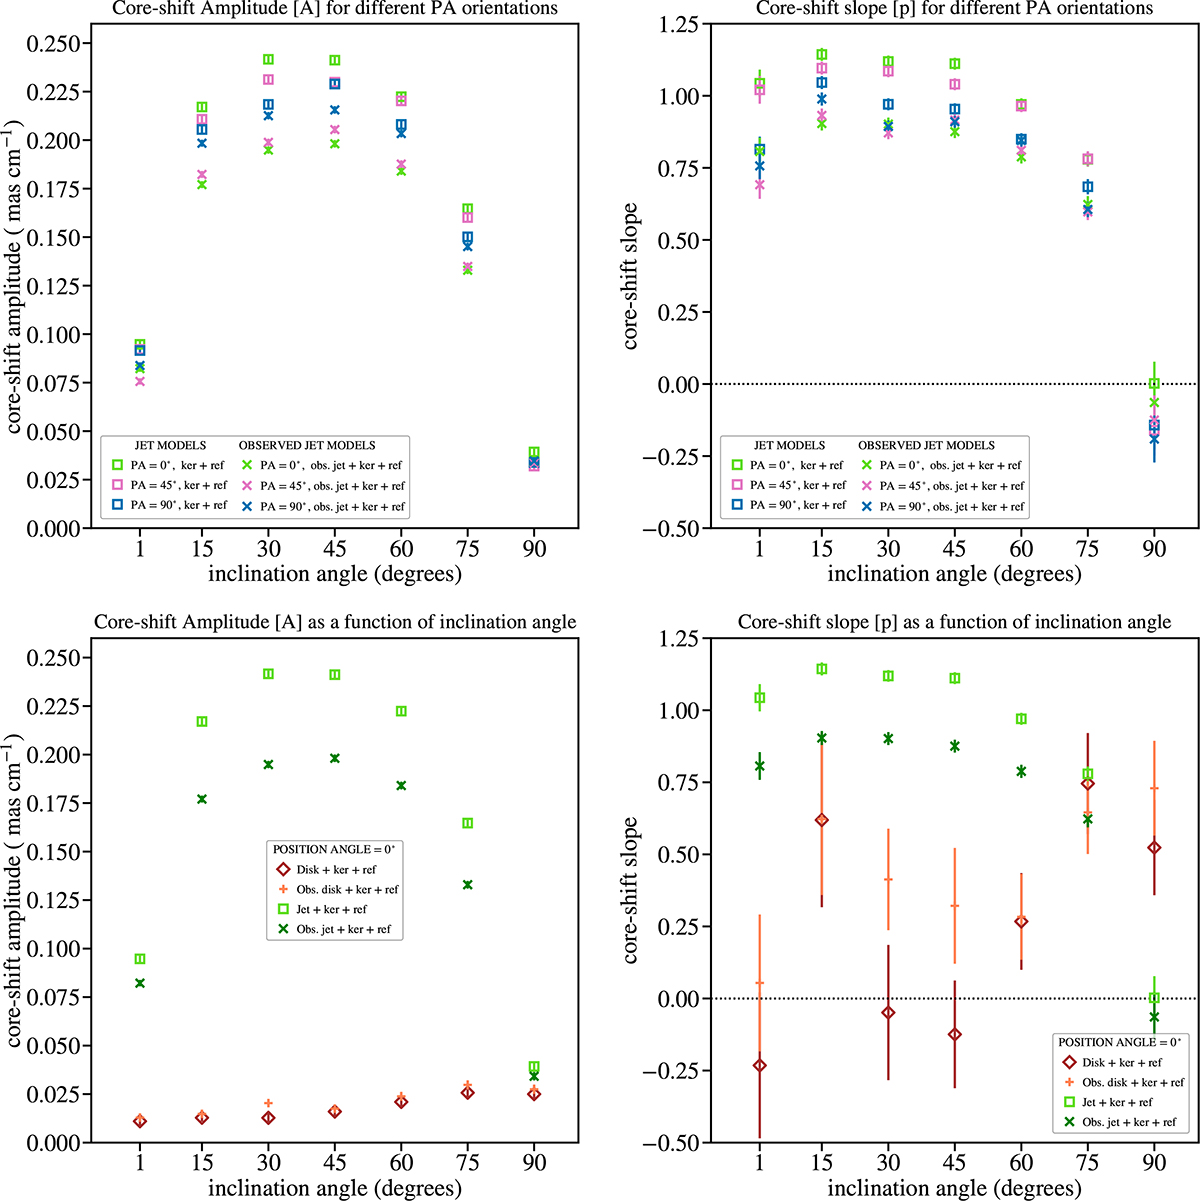
Fig. 15.
Download original image
Core-shift parameters of observed models as a function of inclination angle for different spin axis orientations. Similar to Fig. 11 but including models observed by the VLBA. Top left: Core-shift amplitude (A) versus inclination angle (i) for different position angle (PA) orientations of the BH spin axis. Squares represent A values for scattered jet models with PA = 0°, 45°, 90° (shown in different colors) which have been scattered by the broadening kernel including refractive noise, crosses are the same scattered jet models but observed by the VLBA. Top right: Same as the left, but displaying the core-shift slope (p), which is the index of the power-law relation rcore = Aλp. Bottom left: Core-shift amplitude (A) versus inclination angle (i) for scattered disk models (brown diamonds), observed scattered disk models (orange plus markers), scattered jet models (green squares) and observed scattered jet models (dark green crosses) all at a single position angle of PA = 0°. Bottom right: Same as the left plot, but displaying the core-shift slope (p) for the same models. All plots include 1σ error bars obtained from the power-law fits.
Current usage metrics show cumulative count of Article Views (full-text article views including HTML views, PDF and ePub downloads, according to the available data) and Abstracts Views on Vision4Press platform.
Data correspond to usage on the plateform after 2015. The current usage metrics is available 48-96 hours after online publication and is updated daily on week days.
Initial download of the metrics may take a while.