Fig. 5.
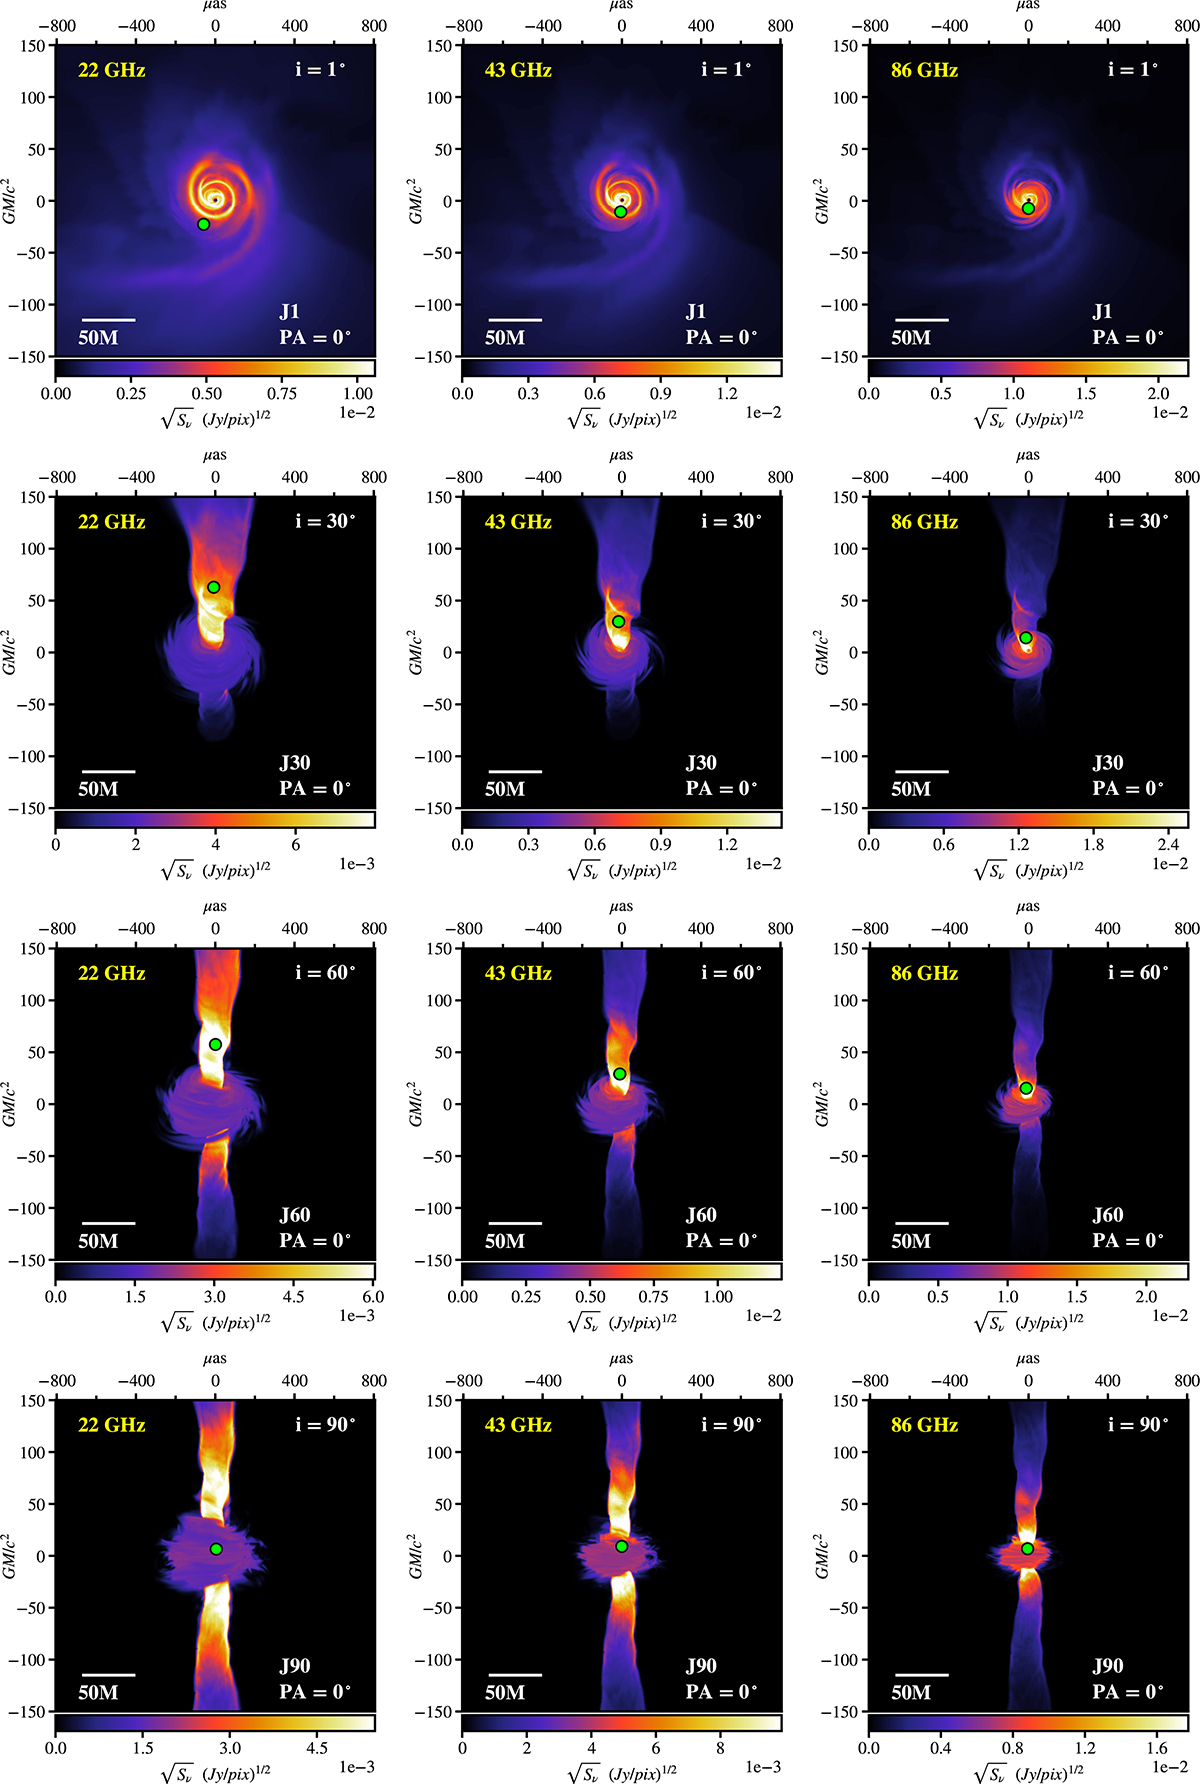
Download original image
Flux density (Sν) maps of jet models. Rows show jet models with different inclinations with respect to the observer’s line of sight (i = 1°, 30°, 60°, and 90°, top to bottom). The position angle on the sky of the BH spin axis is PA = 0° for all models. Columns show the maps at different frequencies (22 GHz, 43 GHz, and 86 GHz, left to right). The FOV for each panel is 300 × 300 GM/c2 (1600 × 1600 μas). The bottom color bar indicates the flux density in square-root scale, the y axis shows the distance from the BH (located at 0,0) in units of GM/c2, and the top x axis that same distance in μas. The green dot represents the position of the intensity weighted centroid.
Current usage metrics show cumulative count of Article Views (full-text article views including HTML views, PDF and ePub downloads, according to the available data) and Abstracts Views on Vision4Press platform.
Data correspond to usage on the plateform after 2015. The current usage metrics is available 48-96 hours after online publication and is updated daily on week days.
Initial download of the metrics may take a while.