Open Access
Fig. 10
Download original image
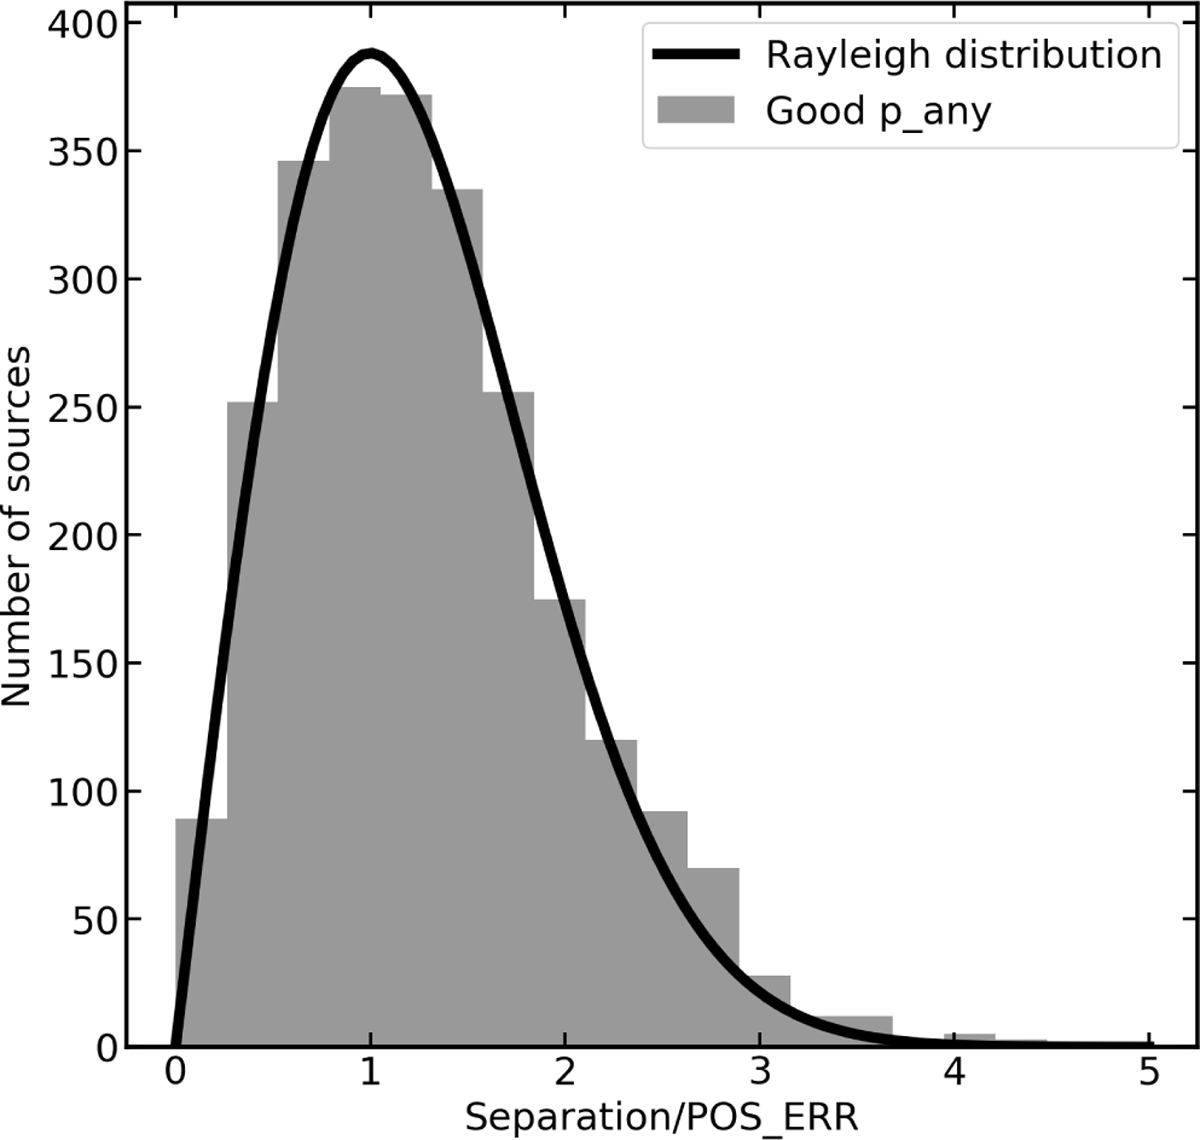
Distribution of separations between the optical and X-ray positions, divided by the X-ray positional errors. The sources with good p_any are shown in grey, and the expected Rayleigh distribution is shown as a solid black curve.
Current usage metrics show cumulative count of Article Views (full-text article views including HTML views, PDF and ePub downloads, according to the available data) and Abstracts Views on Vision4Press platform.
Data correspond to usage on the plateform after 2015. The current usage metrics is available 48-96 hours after online publication and is updated daily on week days.
Initial download of the metrics may take a while.