Fig. 11
Download original image
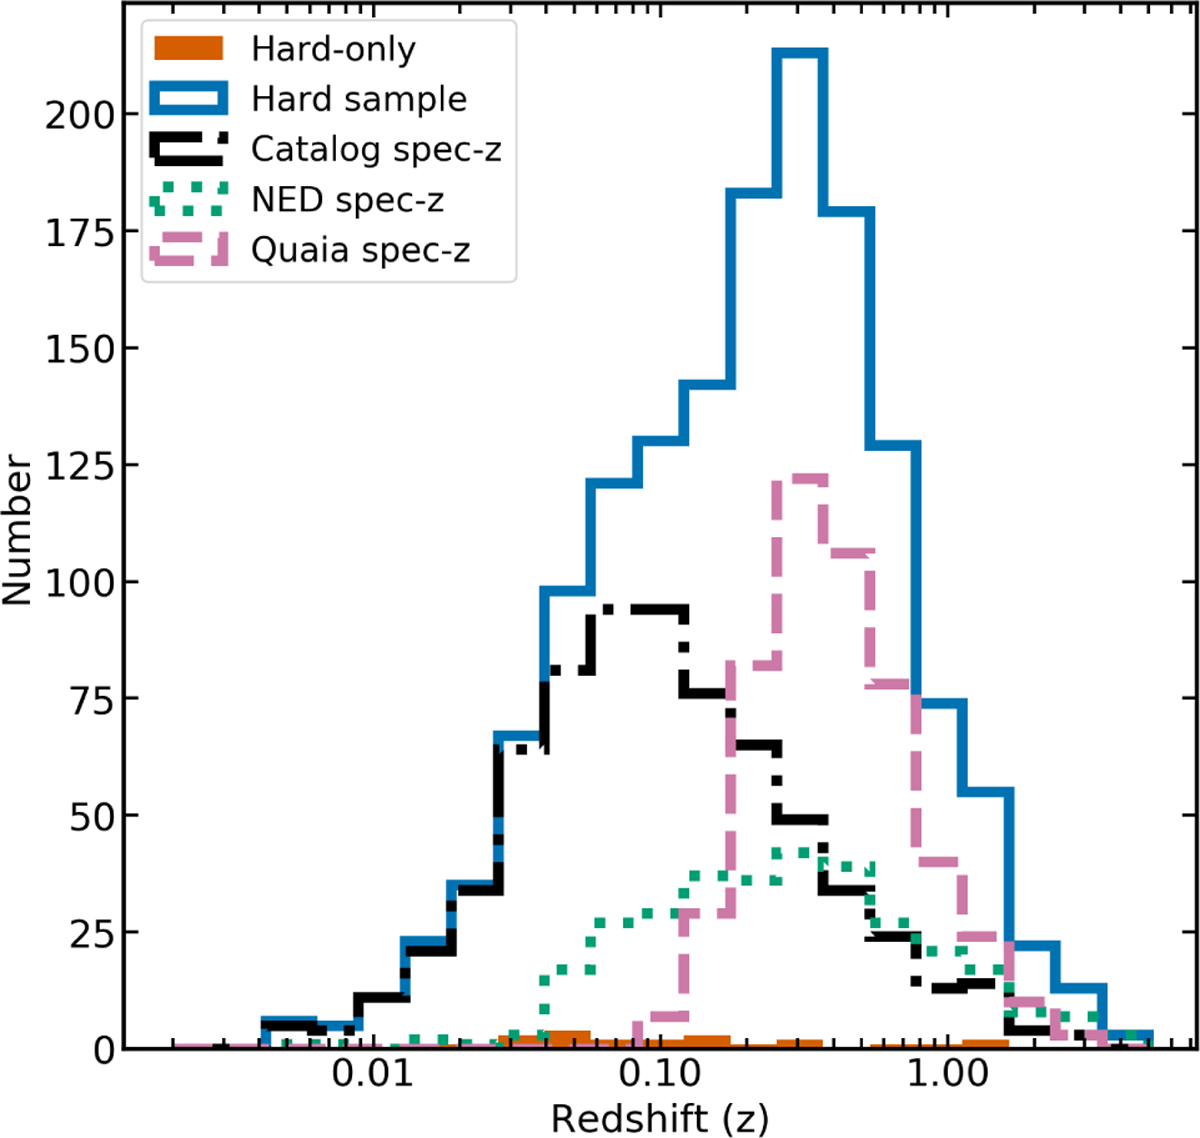
Distributions of spectroscopic redshifts for the eROSITA hard sample. The hard sample is shown as a blue solid line, and the hard-only sample is shown as an orange filled histogram. Spec-z data from the spectroscopic redshift catalogue are shown as a black dash-dotted line, and NED spec-z data are shown as green dotted line. The Quaia redshifts are shown as pink dashed lines.
Current usage metrics show cumulative count of Article Views (full-text article views including HTML views, PDF and ePub downloads, according to the available data) and Abstracts Views on Vision4Press platform.
Data correspond to usage on the plateform after 2015. The current usage metrics is available 48-96 hours after online publication and is updated daily on week days.
Initial download of the metrics may take a while.