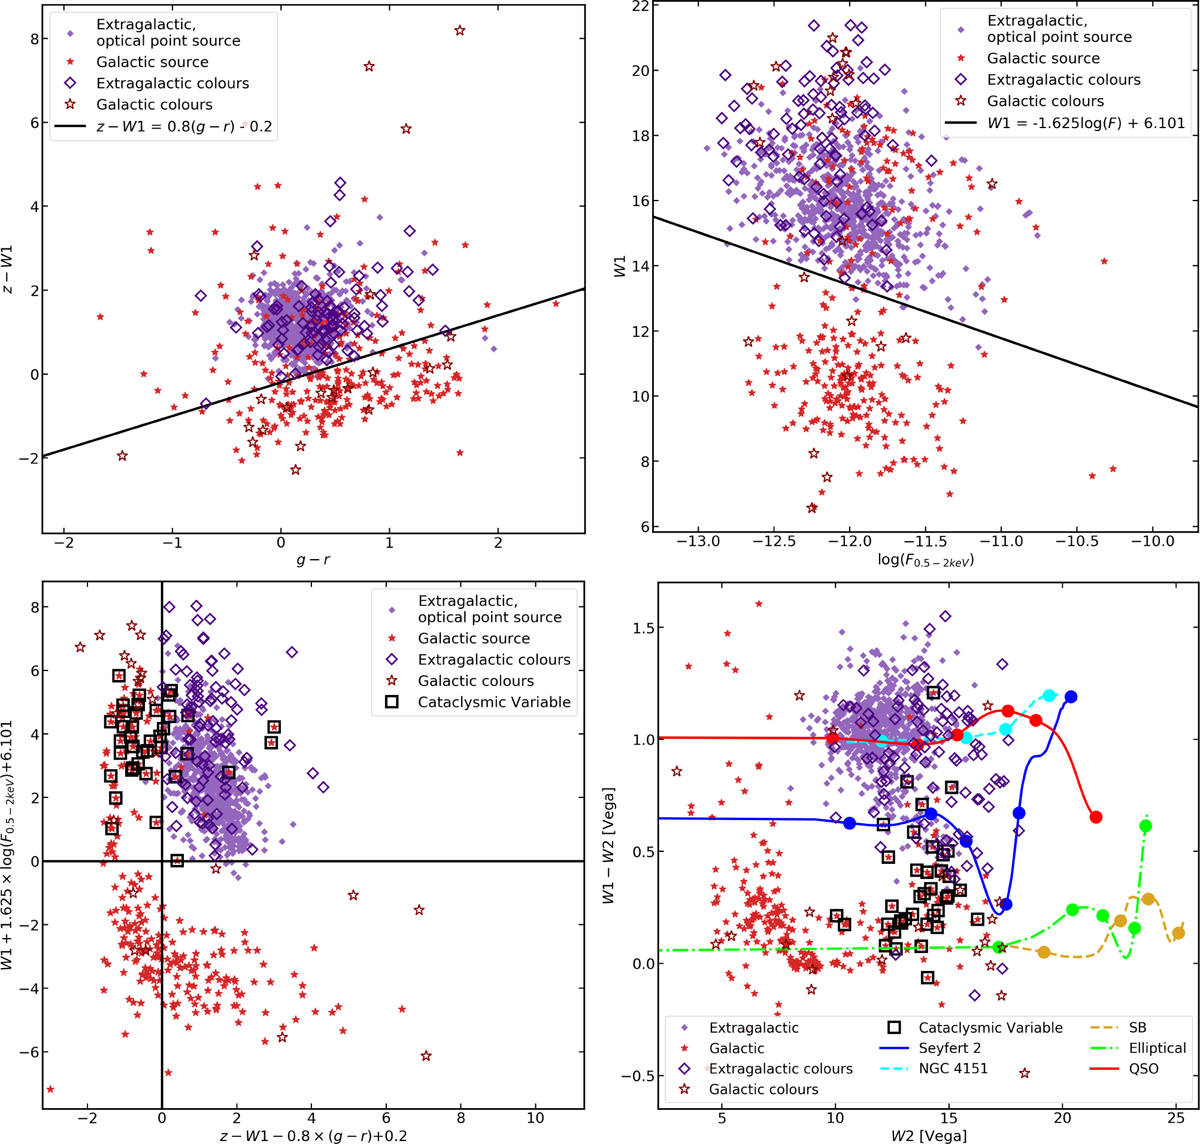
Fig. 12
Download original image
Colour-colour classification plots adapted from Salvato et al. (2022). Only sources with type PSF in LS10 and sources where the signal-to-noise ratio >3 in all photometry bands are plotted. Sources classified as extragalactic (spec-z>0.002) are shown as filled purple diamonds, sources classified as Galactic (significant parallax at >5σ or spec-z<0.002) are shown as filled red stars, sources classified as extragalatic based on their colours are plotted as unfilled dark purple diamonds, and sources classified as Galactic based on their colours are plotted as unfilled dark red stars. These shapes and colours are labelled in the bottom right panel. Cataclysmic variable stars are plotted as unfilled black squares in the bottom plots. The tracks on the bottom right show the evolution of the colour-magnitude space occupied by different sources, with increasing redshift from left to right. Redshift ticks can be found at z = 0.04, 0.2, 0.4, 0.92, and where available at z = 1.4, 3.8.
Current usage metrics show cumulative count of Article Views (full-text article views including HTML views, PDF and ePub downloads, according to the available data) and Abstracts Views on Vision4Press platform.
Data correspond to usage on the plateform after 2015. The current usage metrics is available 48-96 hours after online publication and is updated daily on week days.
Initial download of the metrics may take a while.