Fig. 14
Download original image
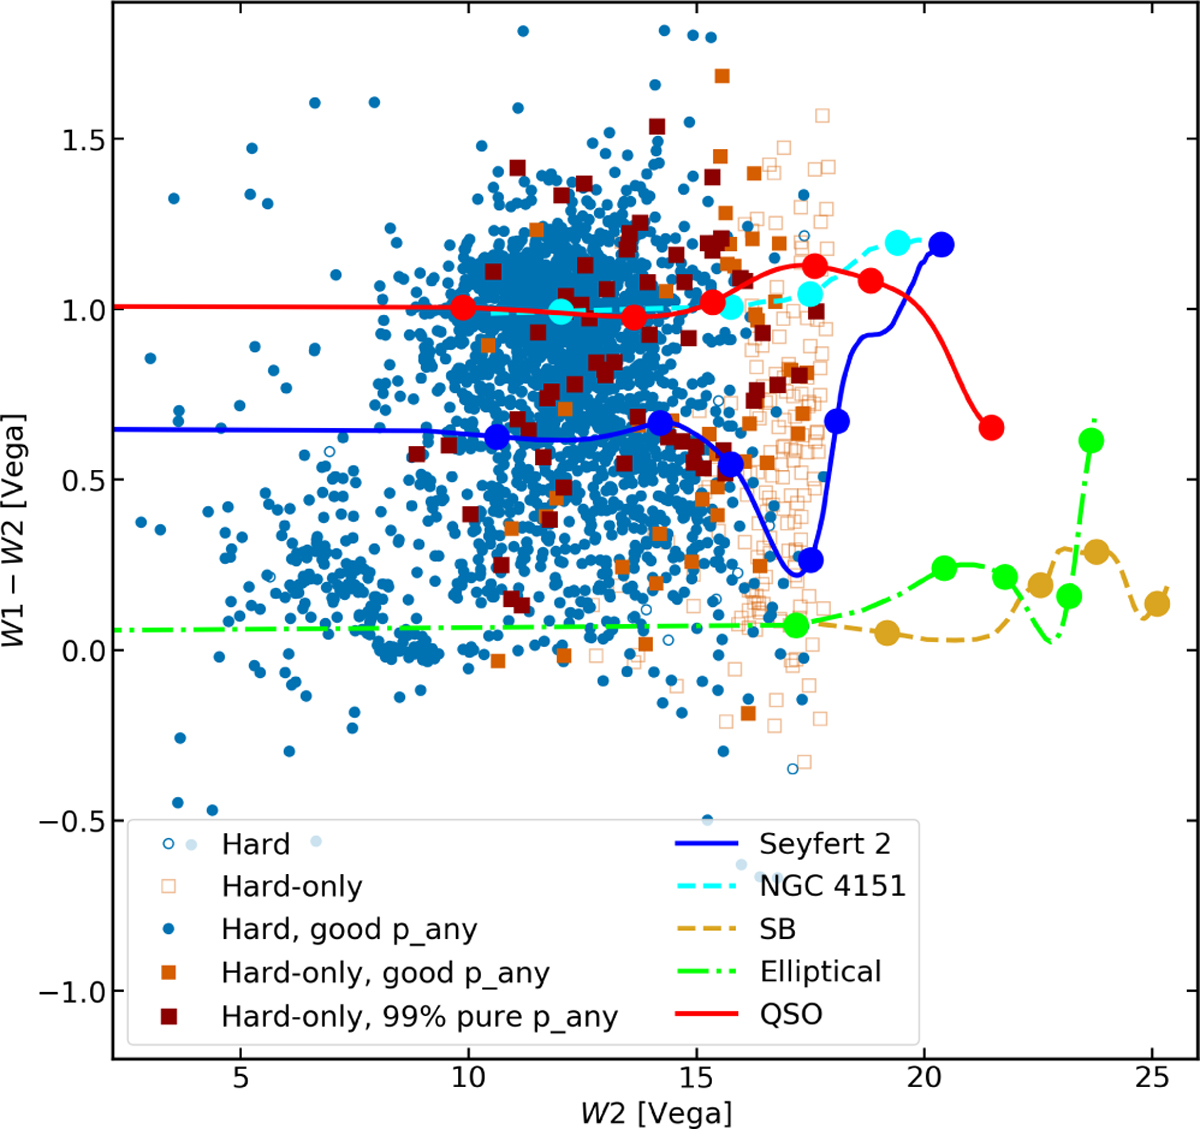
W1-W2 and W2 magnitudes shown for the eRASS1 hard sample. All hard sources with p_any less than the threshold of 0.033 are shown as blue unfilled circles, and sources with good p_any are as with blue filled circles. Hard-only sources with p_any less than the threshold of 0.061 are shown as orange unfilled squares, and hard-only sources with good p_any are shown as orange filled squares. Tracks as in Salvato et al. (2022) and Fig. 12 of this work are shown in various line styles and colours. Redshift ticks can be found at z = 0.04, 0.2, 0.4, 0.92, and where available at z = 1.4, 3.8.
Current usage metrics show cumulative count of Article Views (full-text article views including HTML views, PDF and ePub downloads, according to the available data) and Abstracts Views on Vision4Press platform.
Data correspond to usage on the plateform after 2015. The current usage metrics is available 48-96 hours after online publication and is updated daily on week days.
Initial download of the metrics may take a while.