Open Access
Fig. 17
Download original image
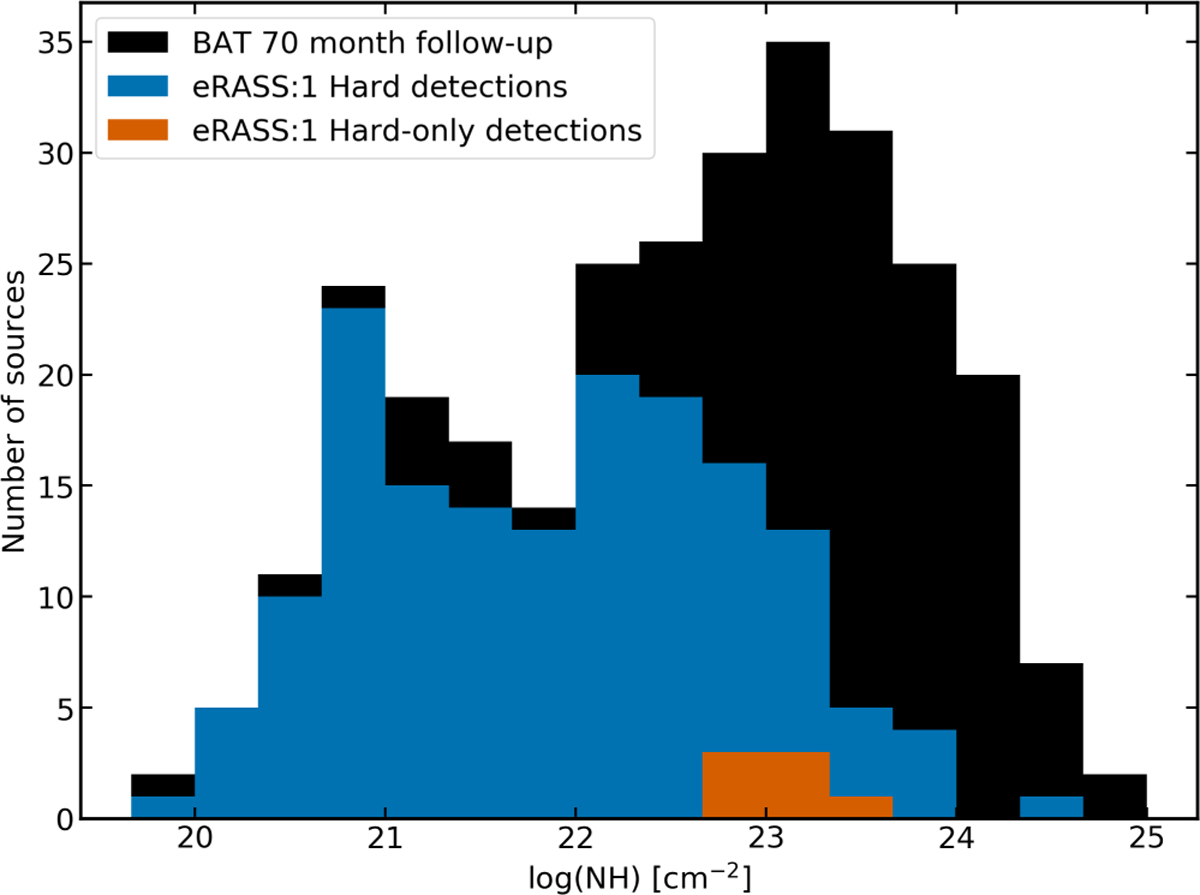
Distribution of column densities log(NH) of sources with soft X-ray detections in the BAT 70 month catalogue, shown for sources in the eROSITA-DE sky (black) and for those matched with eROSITA sources (blue). Hard-only eROSITA sources are shown in orange.
Current usage metrics show cumulative count of Article Views (full-text article views including HTML views, PDF and ePub downloads, according to the available data) and Abstracts Views on Vision4Press platform.
Data correspond to usage on the plateform after 2015. The current usage metrics is available 48-96 hours after online publication and is updated daily on week days.
Initial download of the metrics may take a while.