Fig. 18
Download original image
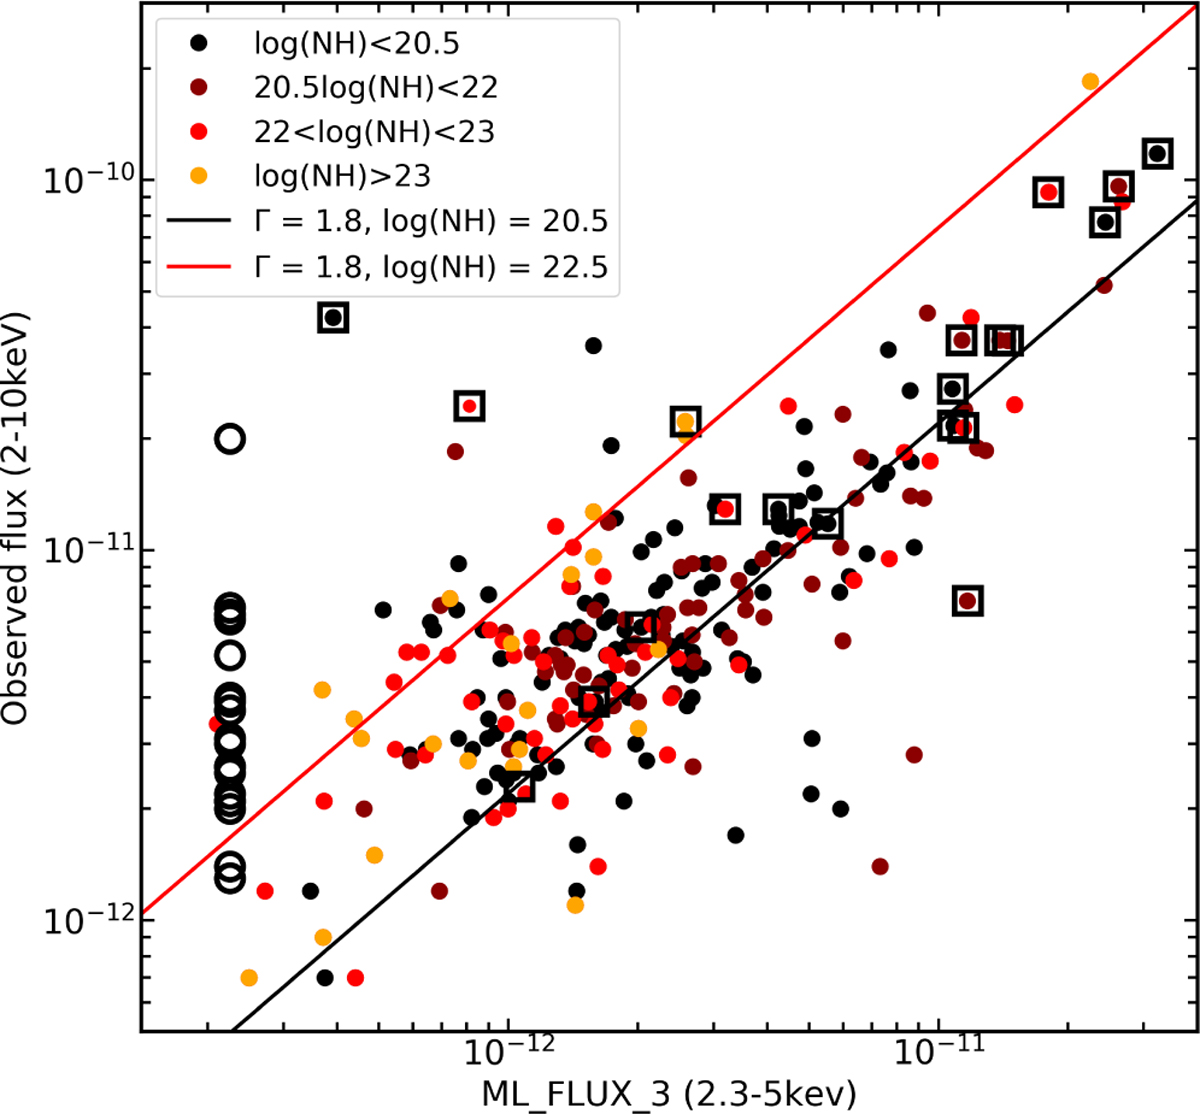
eROSITA 2.3–5 keV fluxes (ML_FLUX_3) and BASS fluxes (2–10 keV) for Piccinotti AGN (black open squares), as well as the other sources in the BAT 70 month sample (circles). Open circles show the sources with non-detections in eROSITA that have measured column densities of NH<1022.5 cm−2. The black solid line shows the equivalent 1-to-1 line assuming a photon index of Γ = 1.8 and a column density of 1020.5 cm−2. The red solid line shows the equivalent 1-to-1 line assuming a photon index of Γ = 1.8 and a column density of 1022.5 cm−2. Black filled circles indicate sources with a measured column density of <1020.5 cm−2, dark red filled circles indicate sources with a measured column densities of 1020.5–22.5 cm−2, red filled circles indicate sources with a measured column density of 1022.5–23 cm−2, and orange filled circles indicate sources with a measured column density of >1023 cm−2.
Current usage metrics show cumulative count of Article Views (full-text article views including HTML views, PDF and ePub downloads, according to the available data) and Abstracts Views on Vision4Press platform.
Data correspond to usage on the plateform after 2015. The current usage metrics is available 48-96 hours after online publication and is updated daily on week days.
Initial download of the metrics may take a while.