Fig. 19
Download original image
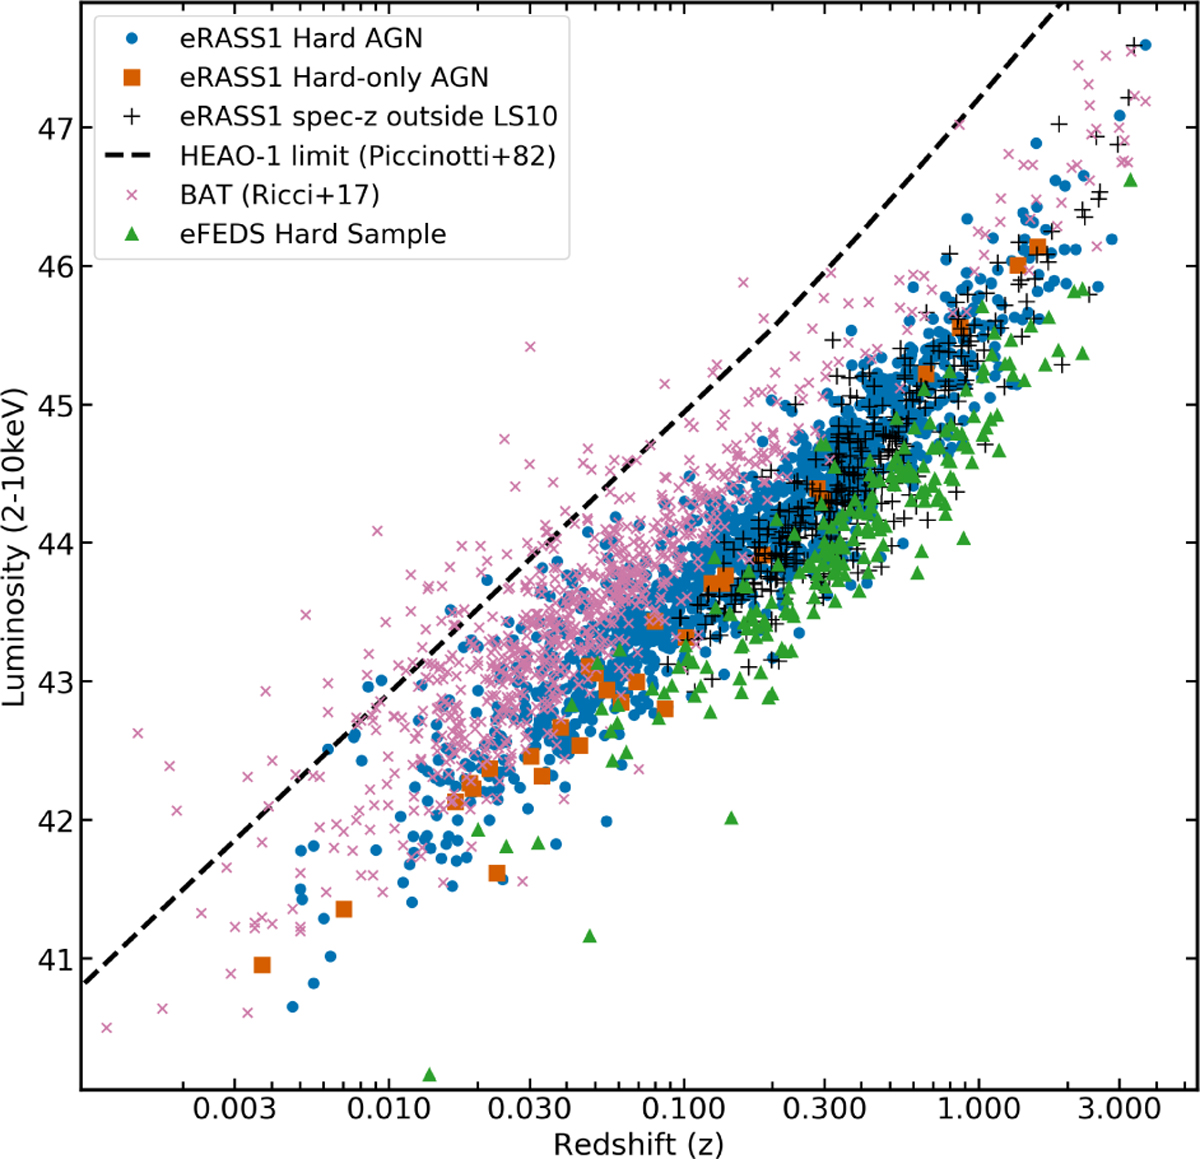
Hard X-ray luminosity vs redshift for various hard X-ray selected samples. eRASS1 AGN are shown as blue circles, eRASS1 hard-only AGN are shown as orange squares, Swift BAT AGN from the 70 month catalogue are shown as pink x, and the eFEDS hard sample are shown as green triangles. The flux limit of HEAO-1 is shown as a black dashed line. Sources outside LS10 with spec-z are shown as black crosses.
Current usage metrics show cumulative count of Article Views (full-text article views including HTML views, PDF and ePub downloads, according to the available data) and Abstracts Views on Vision4Press platform.
Data correspond to usage on the plateform after 2015. The current usage metrics is available 48-96 hours after online publication and is updated daily on week days.
Initial download of the metrics may take a while.