Fig. 2
Download original image
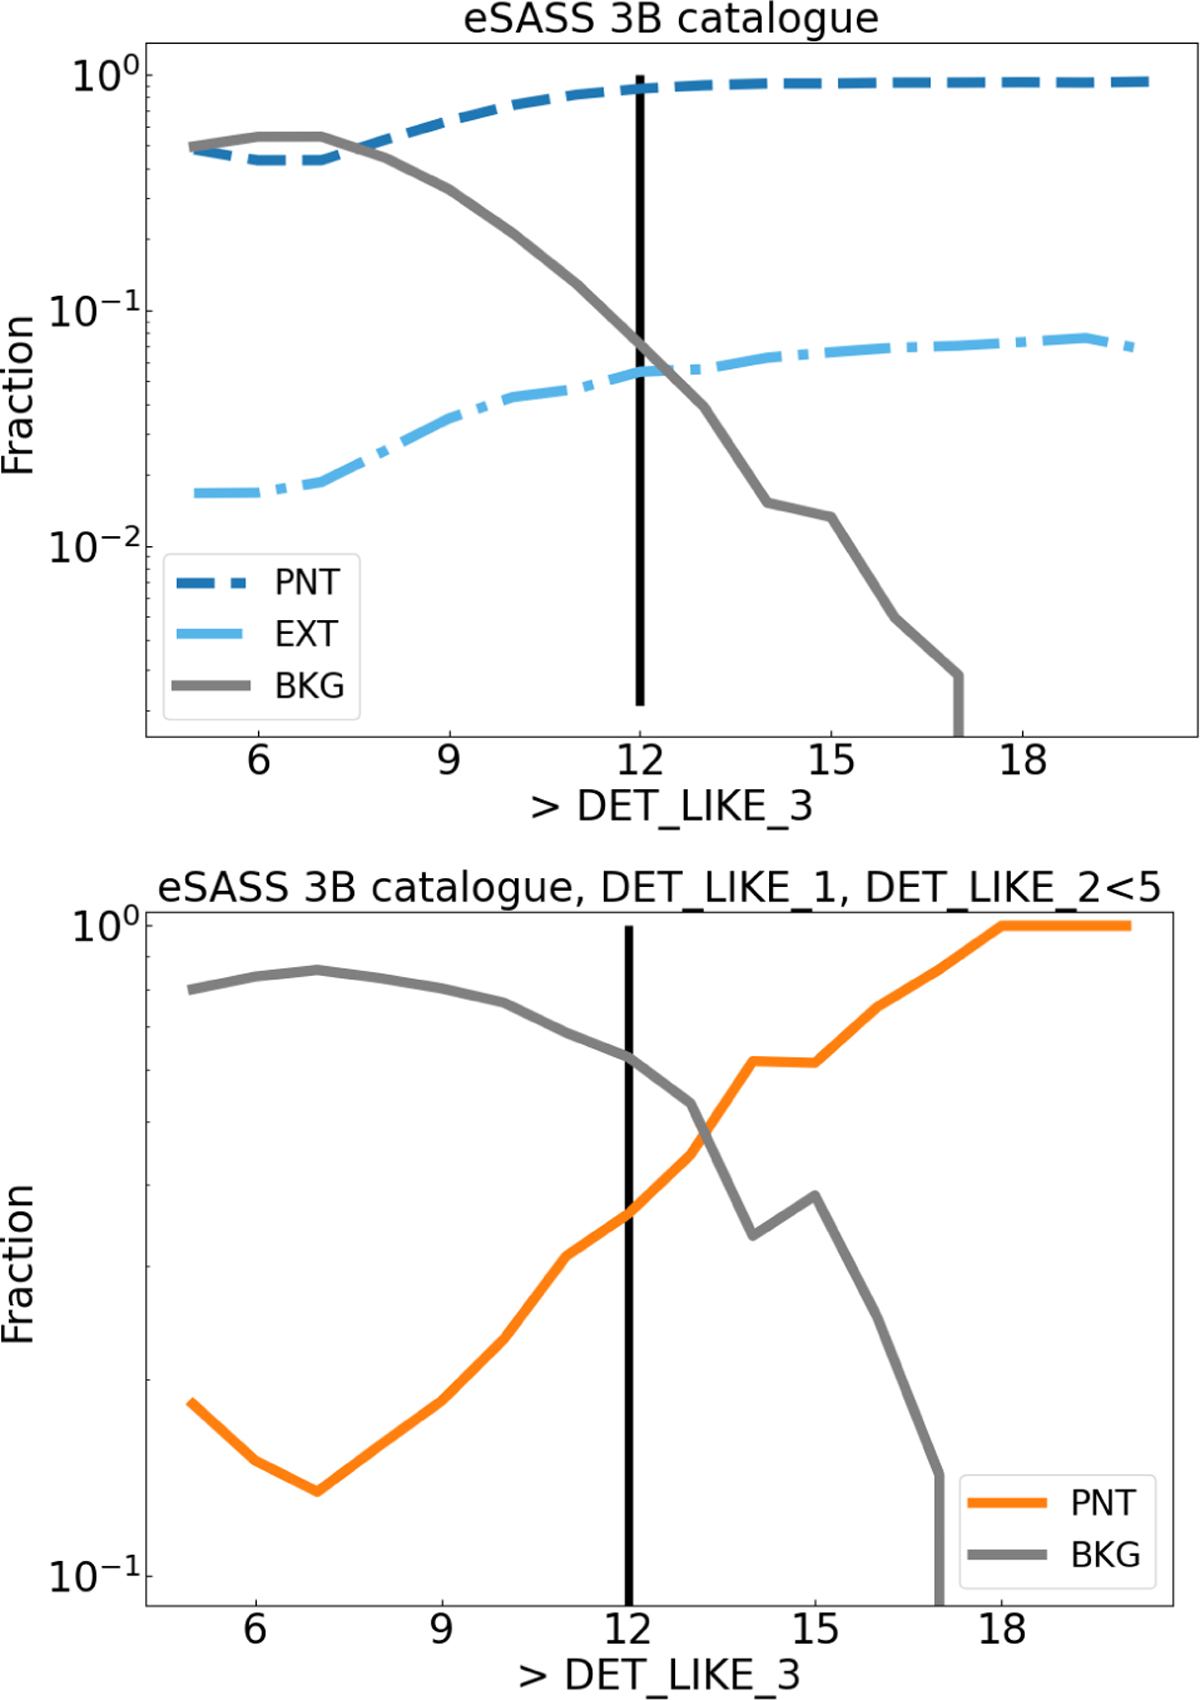
Simulated detection fractions. Top: distribution of population fractions for simulated sources with respect to DET_LIKE_3. Simulated point sources are shown as a blue dashed line labelled PNT, simulated extended sources are shown as a light blue dash-dotted line labelled EXT, and spurious sources (e.g. not real sources in the simulations) are shown as a solid grey line labelled BKG. Bottom: distribution of population fractions for simulated hard-only sources with respect to DET_LIKE_3. Simulated point sources are shown in orange, and background sources are shown as a solid grey line labelled BKG. A solid black line at DET_LIKE_3 of 12 is shown in both panels to indicate our significant detection threshold.
Current usage metrics show cumulative count of Article Views (full-text article views including HTML views, PDF and ePub downloads, according to the available data) and Abstracts Views on Vision4Press platform.
Data correspond to usage on the plateform after 2015. The current usage metrics is available 48-96 hours after online publication and is updated daily on week days.
Initial download of the metrics may take a while.