Fig. 22
Download original image
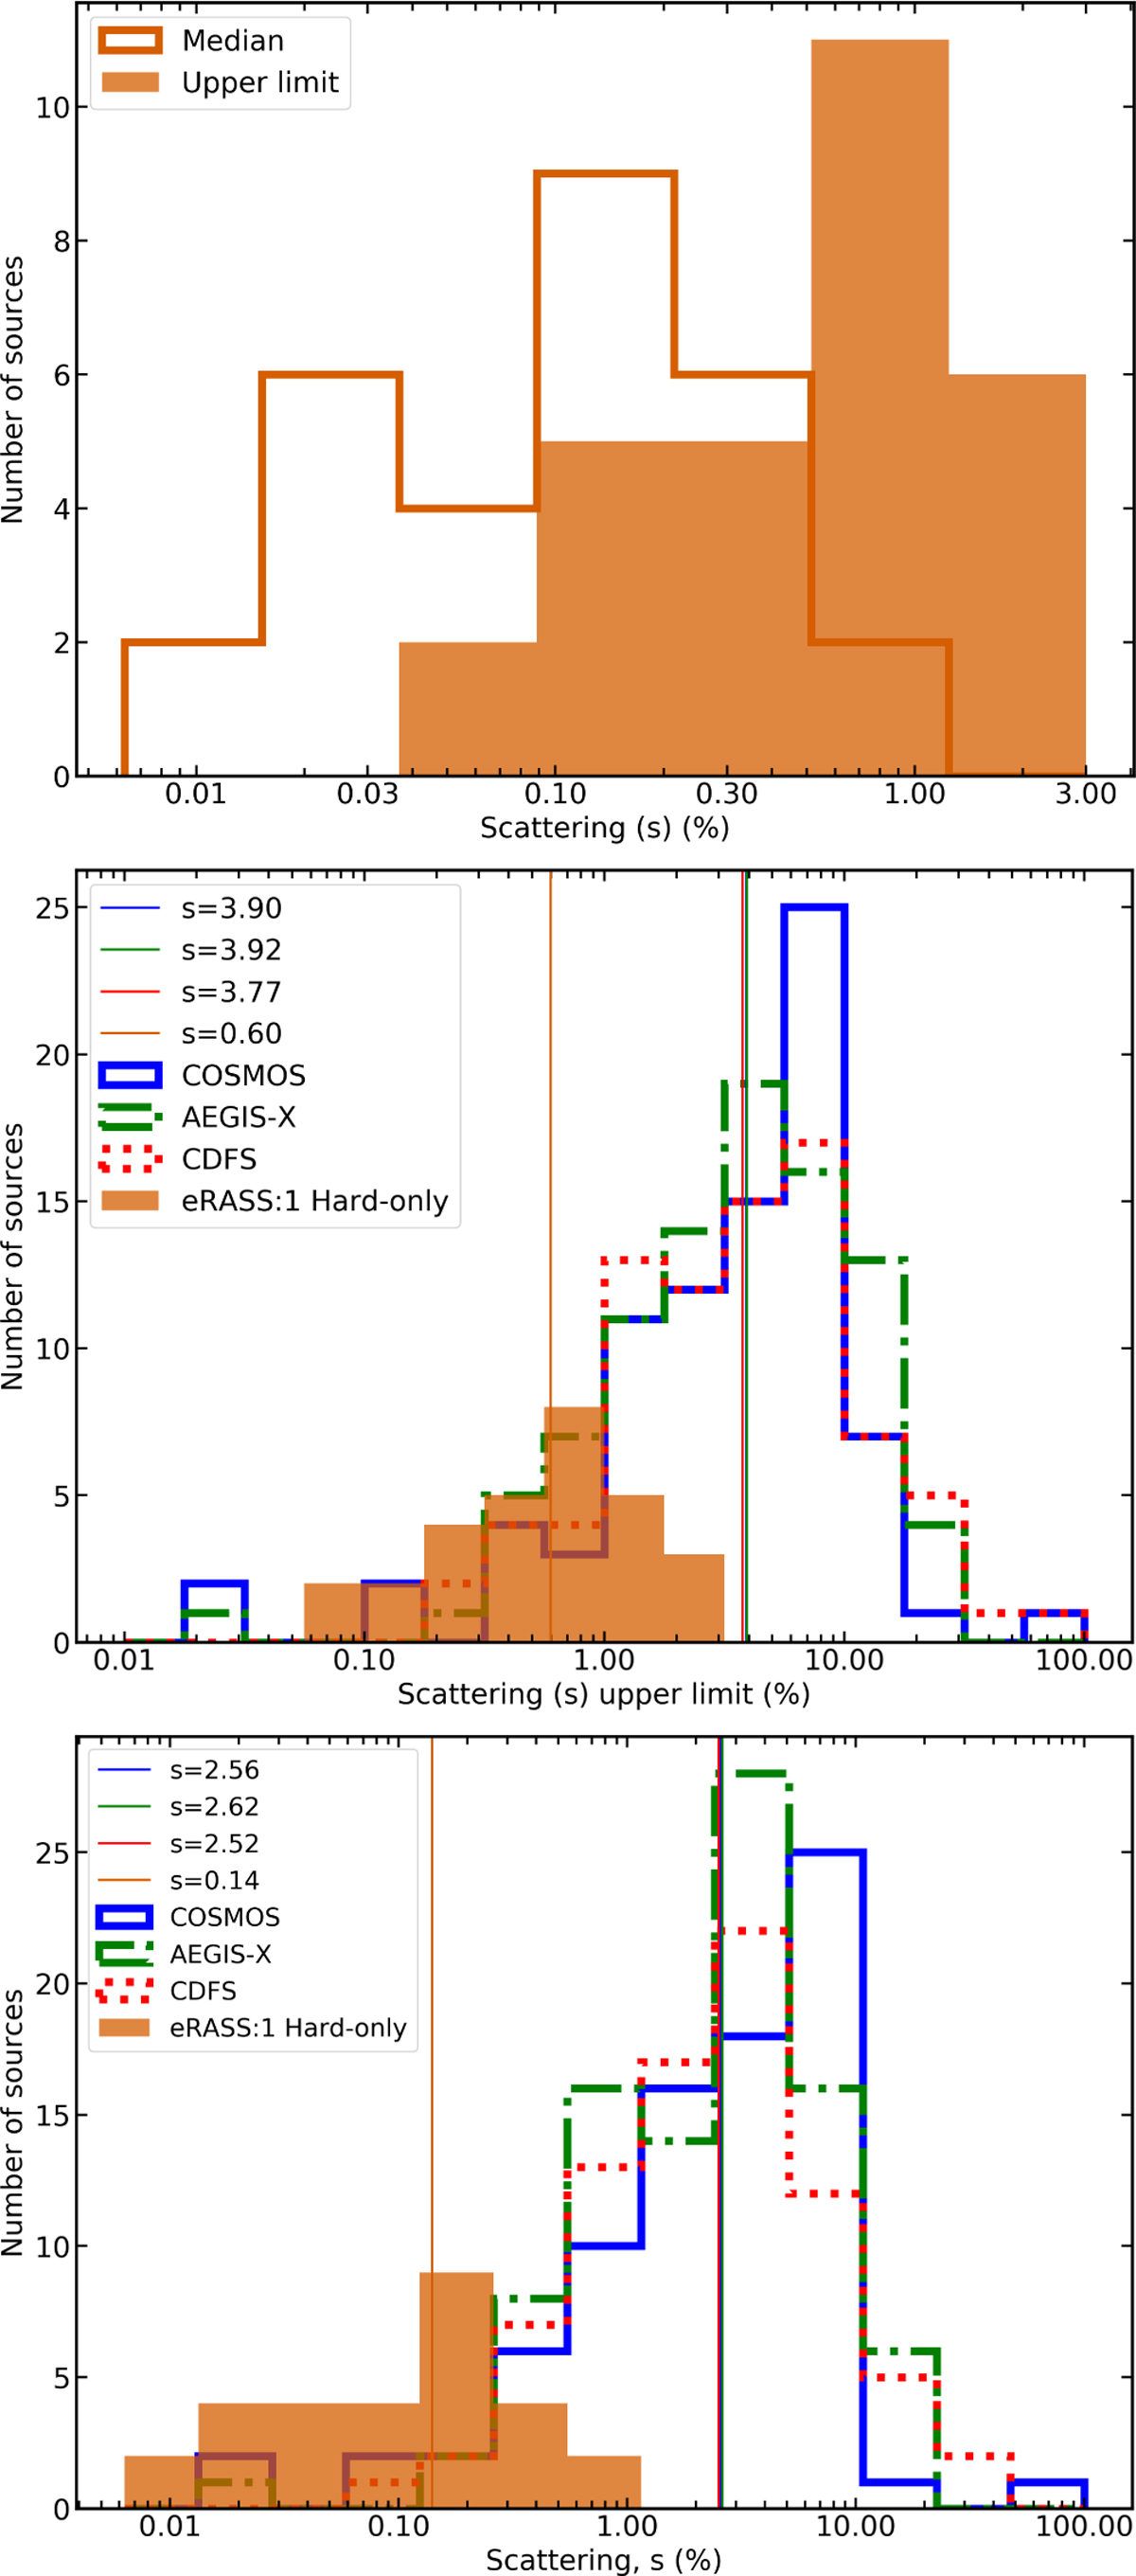
Scattering fractions. Top: distribution of the posterior median of the scattering fraction (orange unfilled histogram) and upper limit of the scattering fraction (orange filled histogram), shown as a percentage, for the eRASS1 spectroscopic hard-only sample. Middle: distributions of the upper limits of the scattering fraction (shown as percentages) for this sample in comparison to the best-fit Chandra results found by Brightman et al. (2014). The distributions measured from COSMOS, AEGIS-X, and CDFS are shown as blue solid, green dash-dotted, and red dotted lines, respectively, all taken from Brightman et al. (2014). The eROSITA values are shown as an orange filled histogram. The median values are shown as vertical lines of corresponding colours, with an almost exact overlap between the COSMOS, AEGIS-X, and CDFS samples. Bottom: same as the middle panel, but for the median scattering fractions (%).
Current usage metrics show cumulative count of Article Views (full-text article views including HTML views, PDF and ePub downloads, according to the available data) and Abstracts Views on Vision4Press platform.
Data correspond to usage on the plateform after 2015. The current usage metrics is available 48-96 hours after online publication and is updated daily on week days.
Initial download of the metrics may take a while.