Fig. 5
Download original image
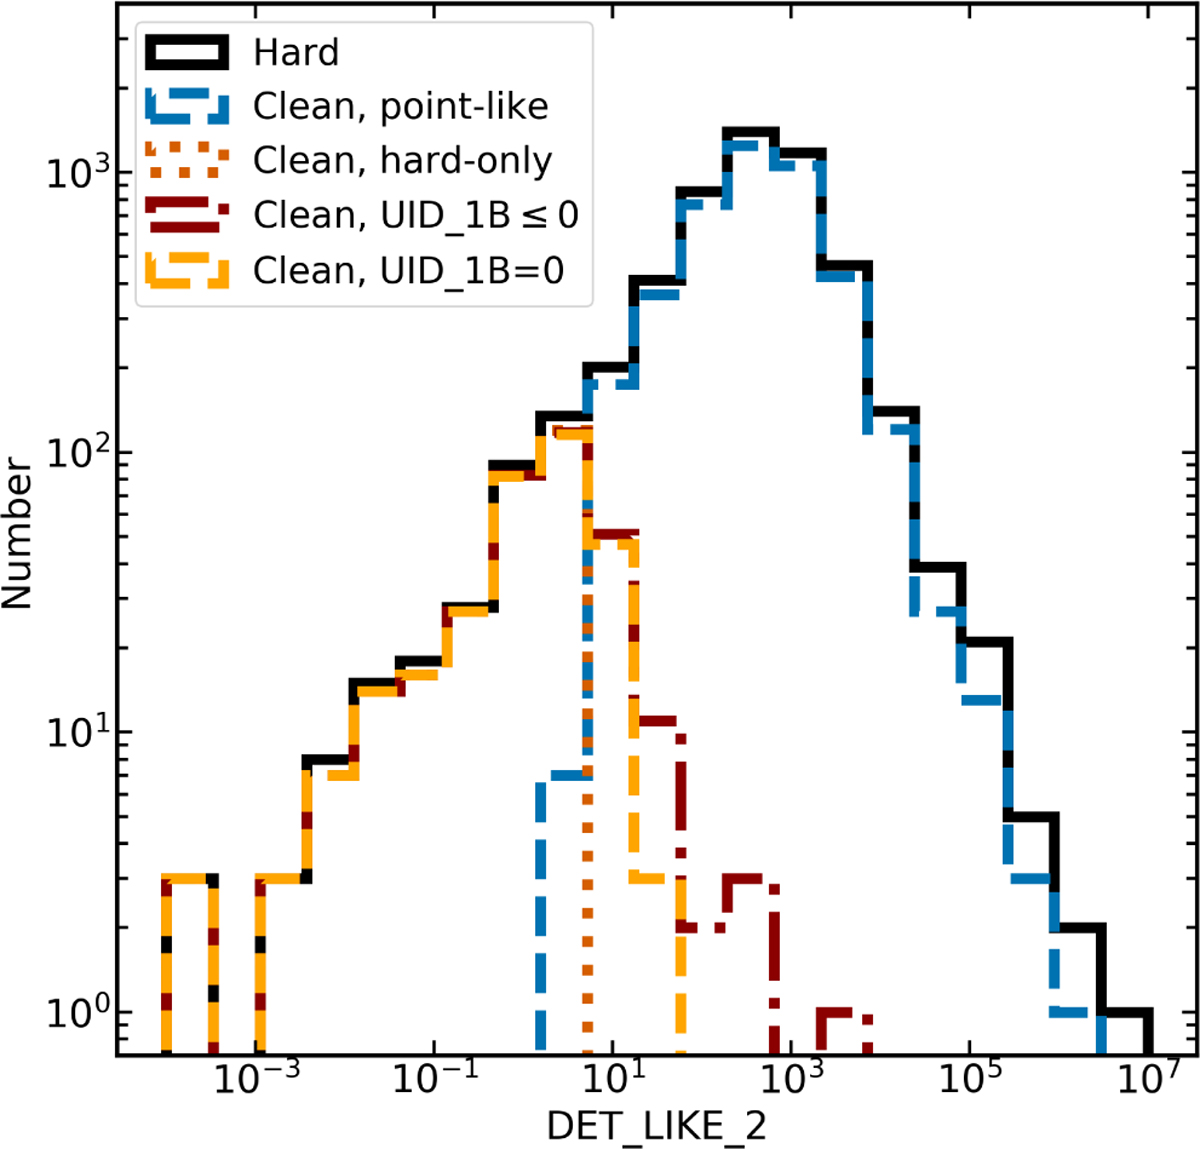
Distribution of DET_LIKE_2 (0.6–2.3 keV) values. The hard sample is shown as a black solid line, and is further subdivided into non-flagged point-like hard sources and point-like hard-only sources (blue dashed line and orange dotted line, respectively). The hard-only samples as defined in Merloni et al. (2024) are also shown: the higher-fidelity, UID_1B=0 sample (pale orange dashed line) and the less pure UID_1B≤0 sample (dark red dash-dotted line).
Current usage metrics show cumulative count of Article Views (full-text article views including HTML views, PDF and ePub downloads, according to the available data) and Abstracts Views on Vision4Press platform.
Data correspond to usage on the plateform after 2015. The current usage metrics is available 48-96 hours after online publication and is updated daily on week days.
Initial download of the metrics may take a while.