Fig. 7
Download original image
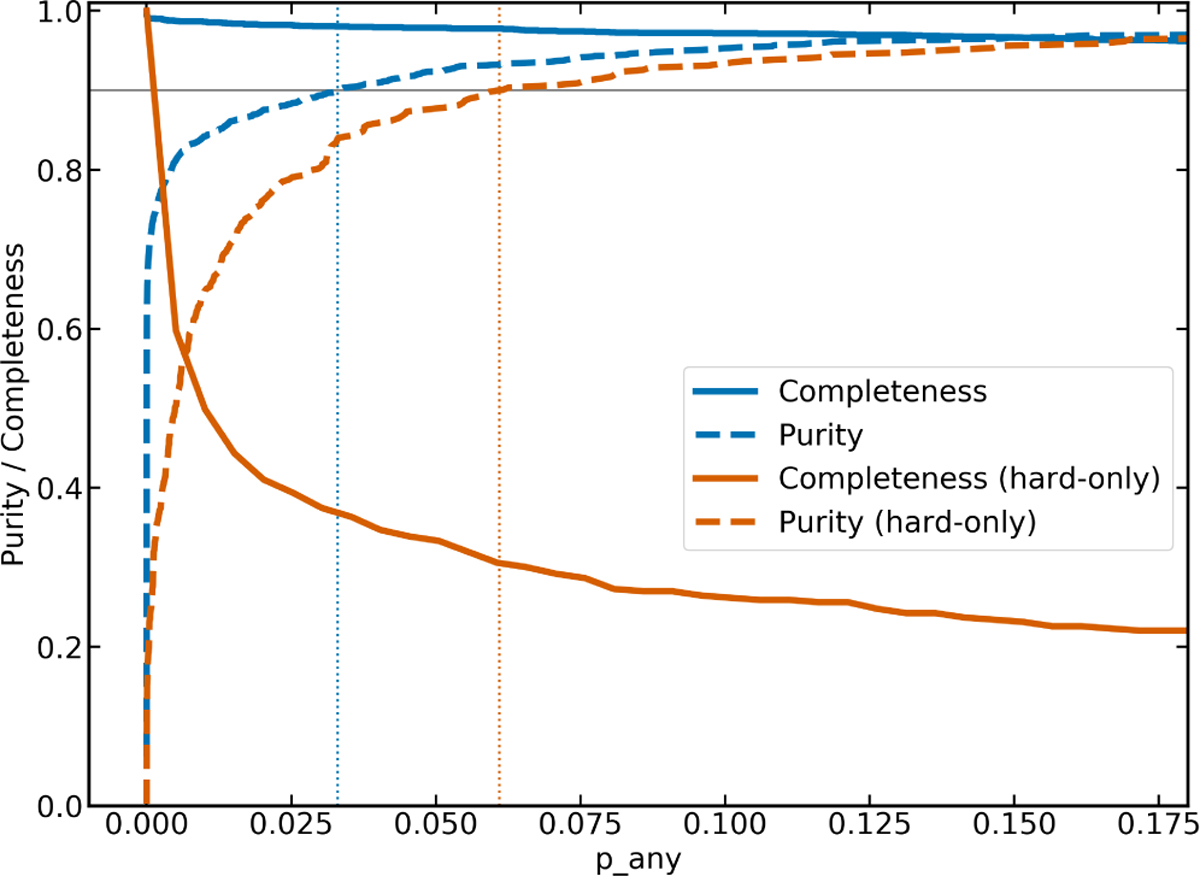
Purity and completeness as a function of p_any values, defined as in Salvato et al. (2022). Purity and completeness for the sample with soft X-ray detections are shown as blue solid and dashed lines, respectively. Purity and completeness for the hard-only sample are shown as orange solid and dashed lines, respectively. The horizontal grey line shows a purity of 0.9, and the vertical dotted lines in corresponding colours indicate the p_any values for the 90% purity cuts.
Current usage metrics show cumulative count of Article Views (full-text article views including HTML views, PDF and ePub downloads, according to the available data) and Abstracts Views on Vision4Press platform.
Data correspond to usage on the plateform after 2015. The current usage metrics is available 48-96 hours after online publication and is updated daily on week days.
Initial download of the metrics may take a while.