Open Access
Fig. 9
Download original image
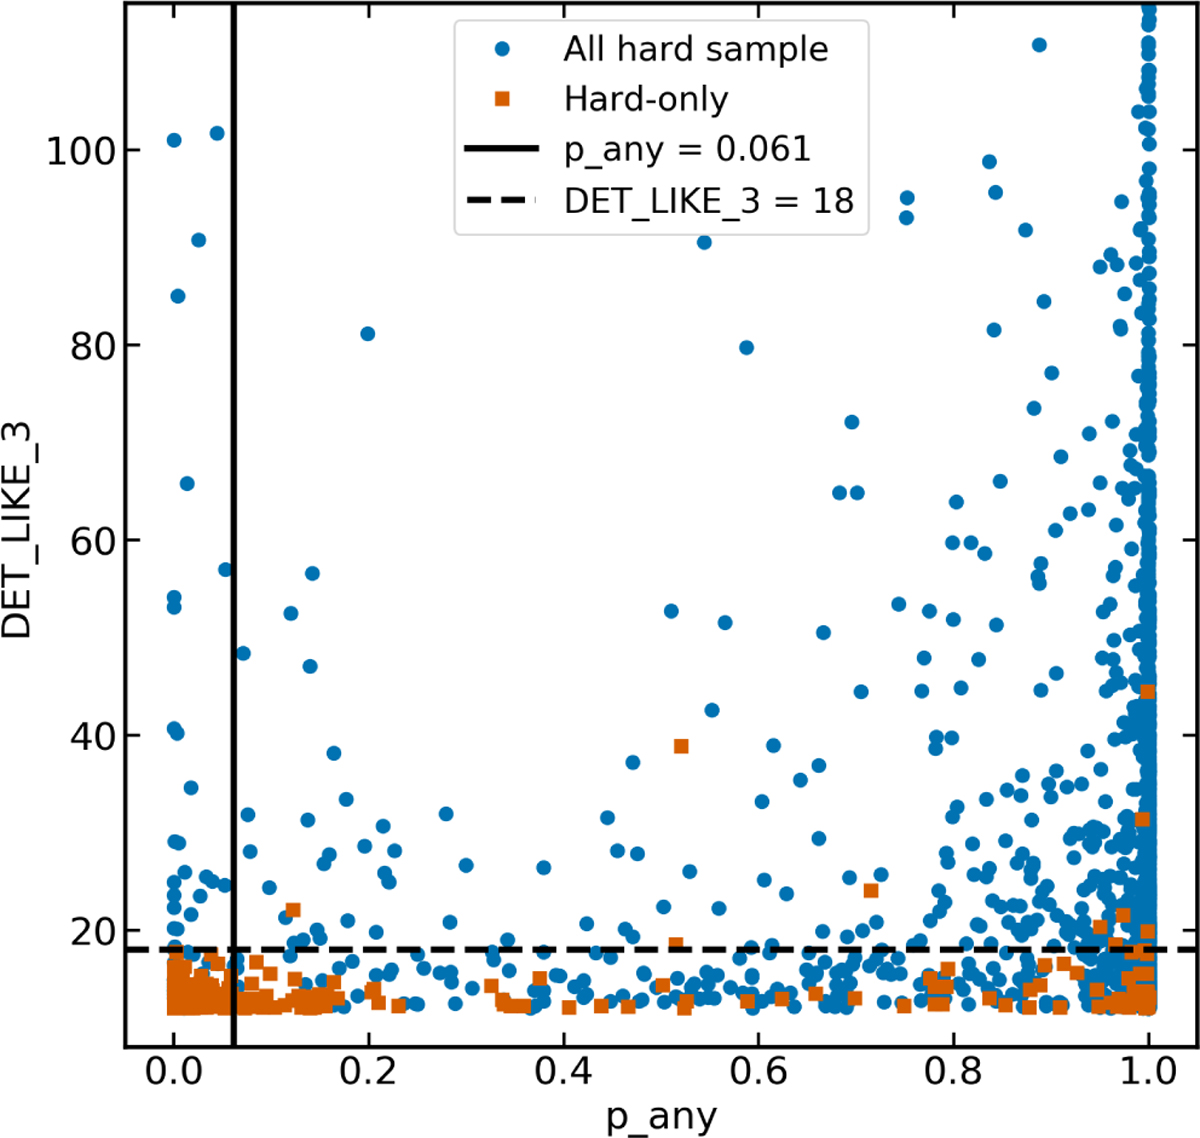
Distribution of DET_LIKE_3 values as a function of p_any, shown for both the hard-only sample (orange) and the remainder of the hard sample (blue). The vertical black line indicates the 90% purity cut on p_any for the hard-only sample and the horizontal dashed line shows a high-fidelity cut of DET_LIKE_3>18.
Current usage metrics show cumulative count of Article Views (full-text article views including HTML views, PDF and ePub downloads, according to the available data) and Abstracts Views on Vision4Press platform.
Data correspond to usage on the plateform after 2015. The current usage metrics is available 48-96 hours after online publication and is updated daily on week days.
Initial download of the metrics may take a while.