Open Access
Fig. 10
Download original image
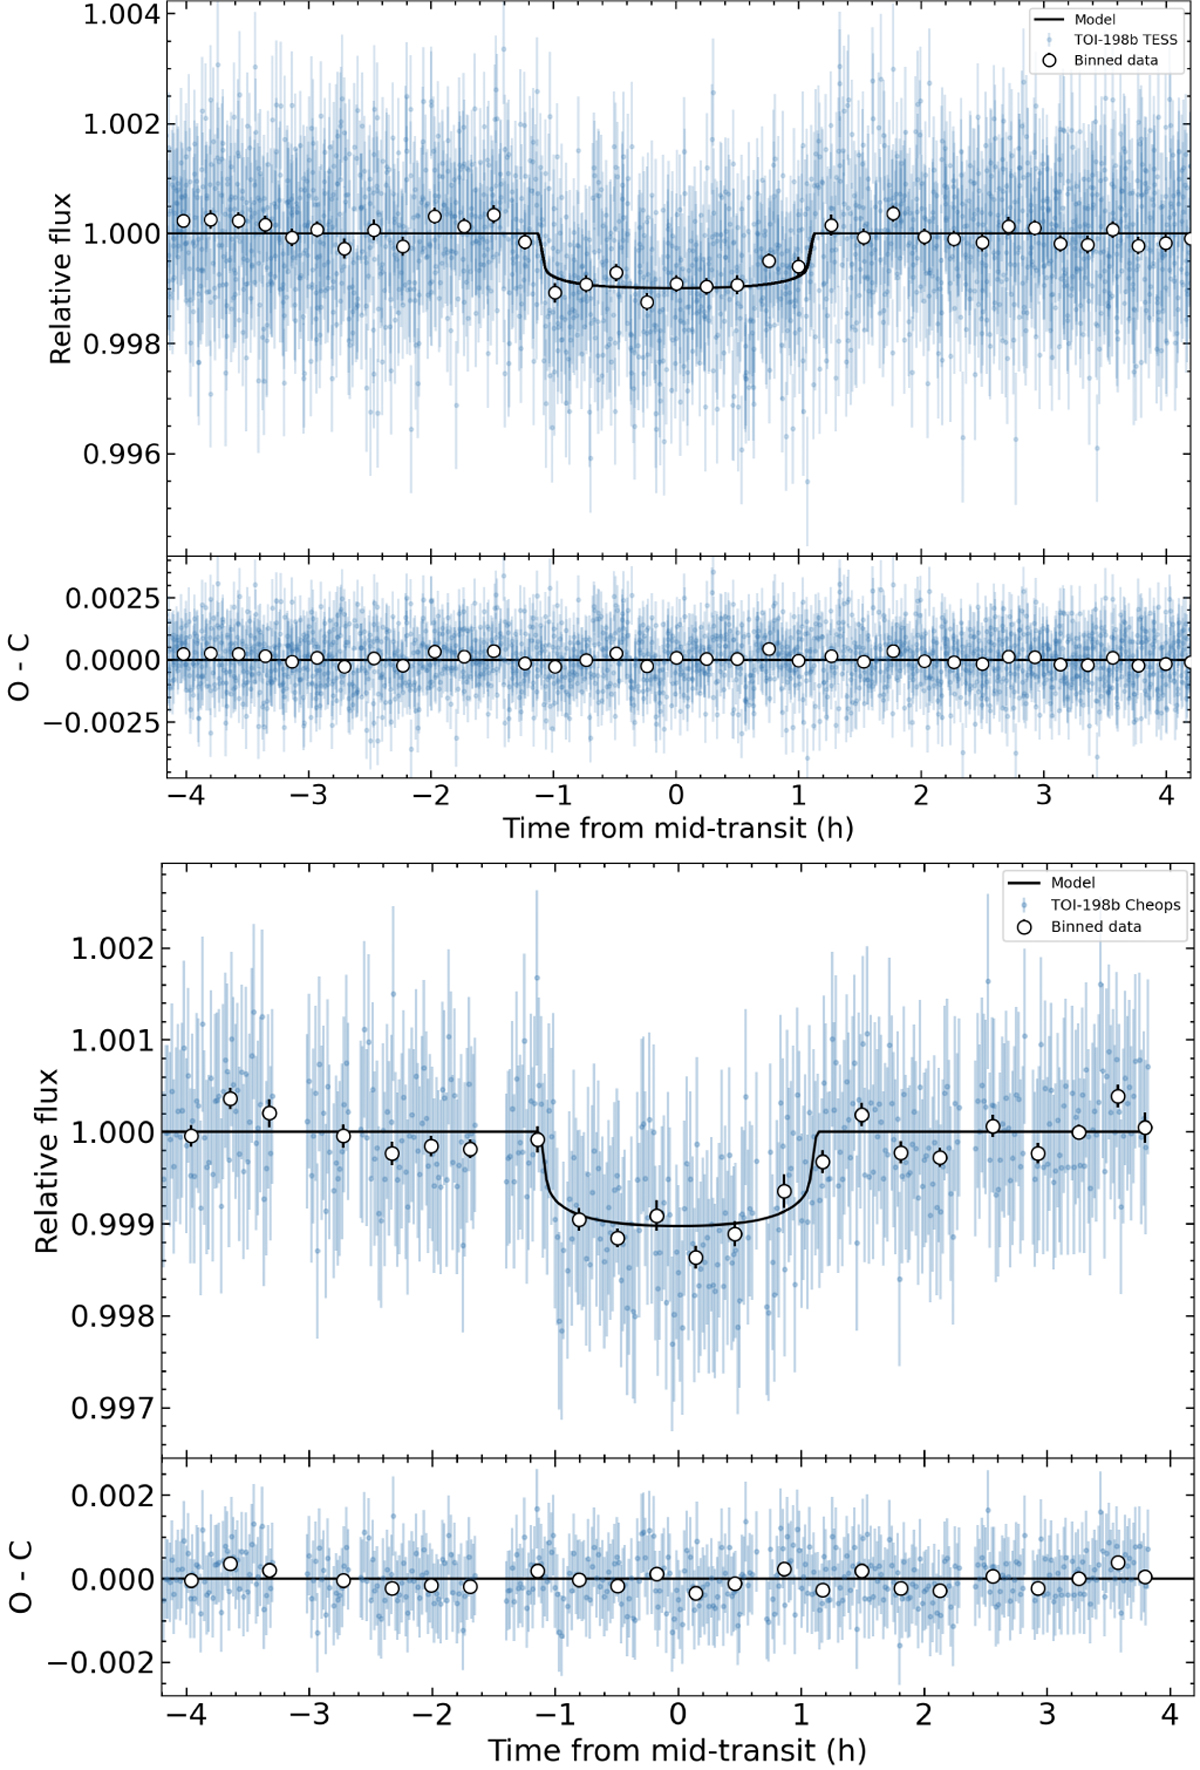
TESS (top) and CHEOPS (bottom) data folded in phase with the planetary orbital period. The white symbols stand for binned data every 51 points (∼ 15 min, TESS) and 19 points (∼19 min, CHEOPS). The black line corresponds to the transit model. Per panel, the bottom, narrower subpanels depict the data residuals.
Current usage metrics show cumulative count of Article Views (full-text article views including HTML views, PDF and ePub downloads, according to the available data) and Abstracts Views on Vision4Press platform.
Data correspond to usage on the plateform after 2015. The current usage metrics is available 48-96 hours after online publication and is updated daily on week days.
Initial download of the metrics may take a while.