Open Access
Fig. 13
Download original image
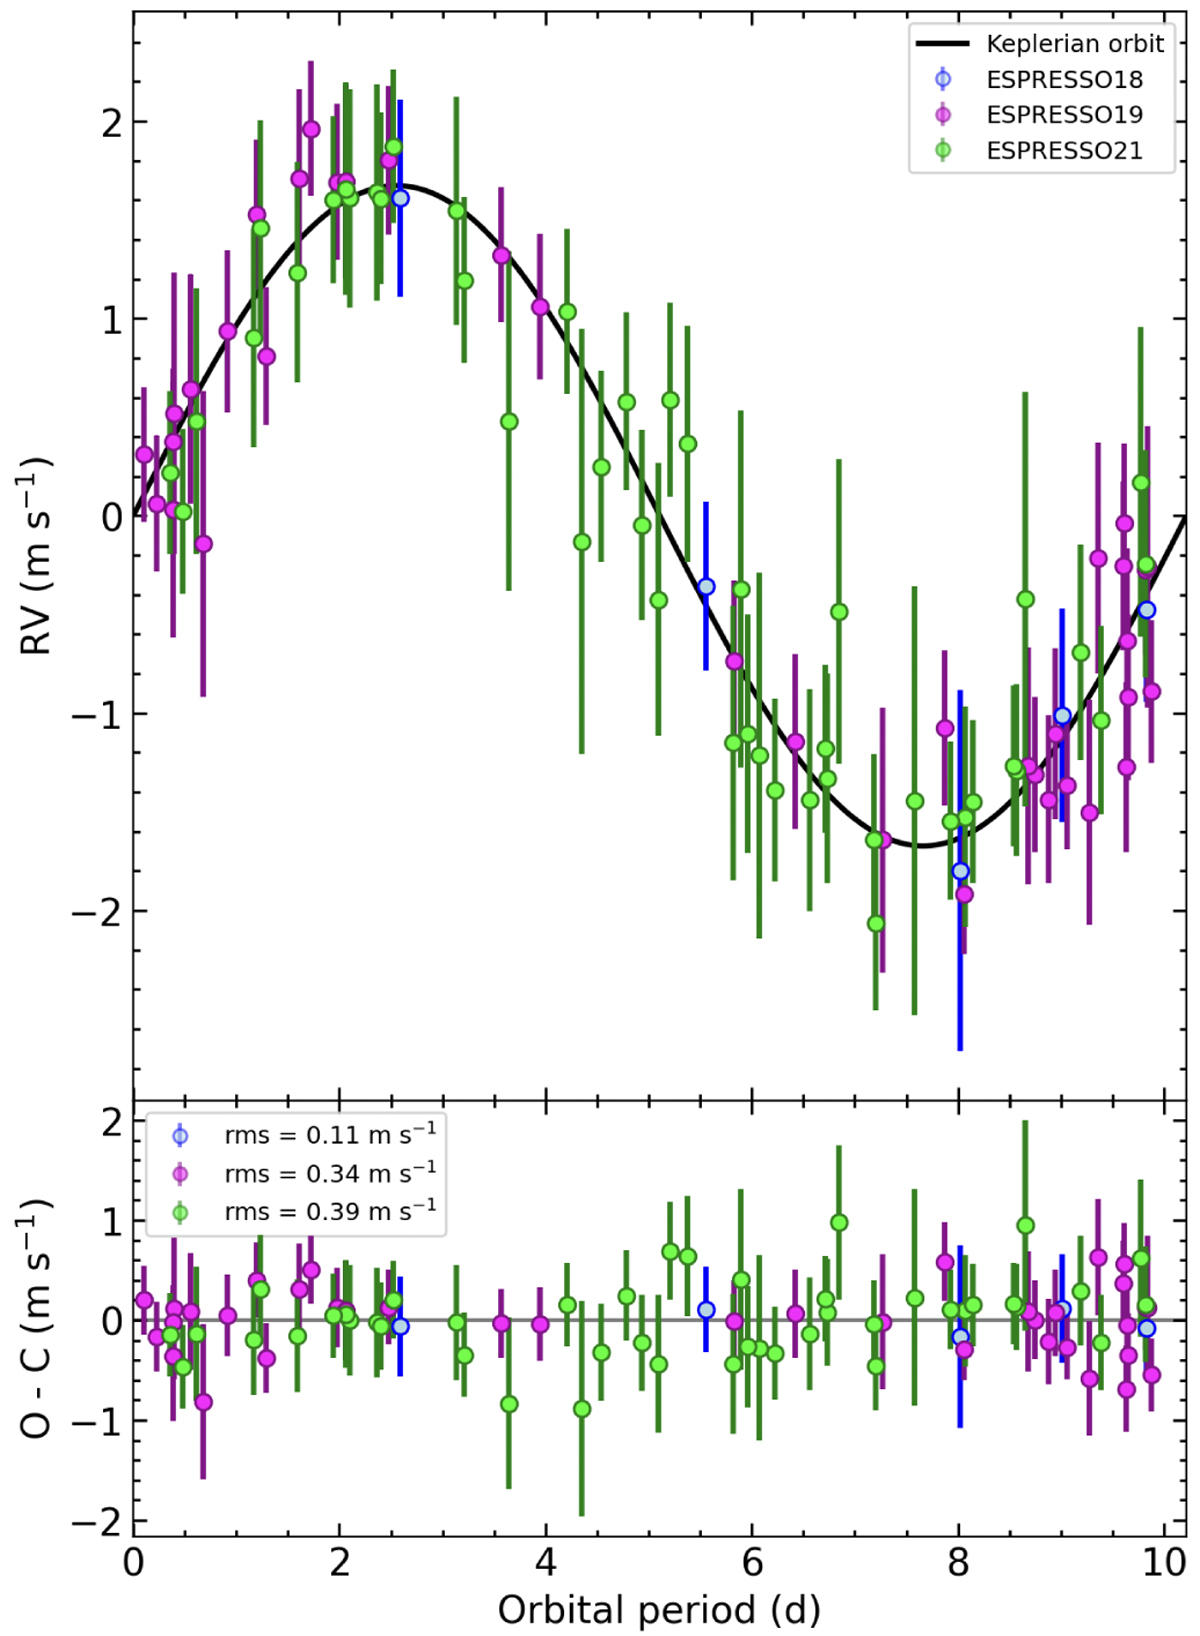
Top panel: ESPRESSO RVs, phase-folded with GJ7 b’s orbital period after removing the stellar activity signal, along with the Kep- lerian model (black curve). Bottom panel: observed-minus-computed residuals. The planet’s mid-transit time (T0) corresponds to half an orbital period.
Current usage metrics show cumulative count of Article Views (full-text article views including HTML views, PDF and ePub downloads, according to the available data) and Abstracts Views on Vision4Press platform.
Data correspond to usage on the plateform after 2015. The current usage metrics is available 48-96 hours after online publication and is updated daily on week days.
Initial download of the metrics may take a while.