Fig. 15
Download original image
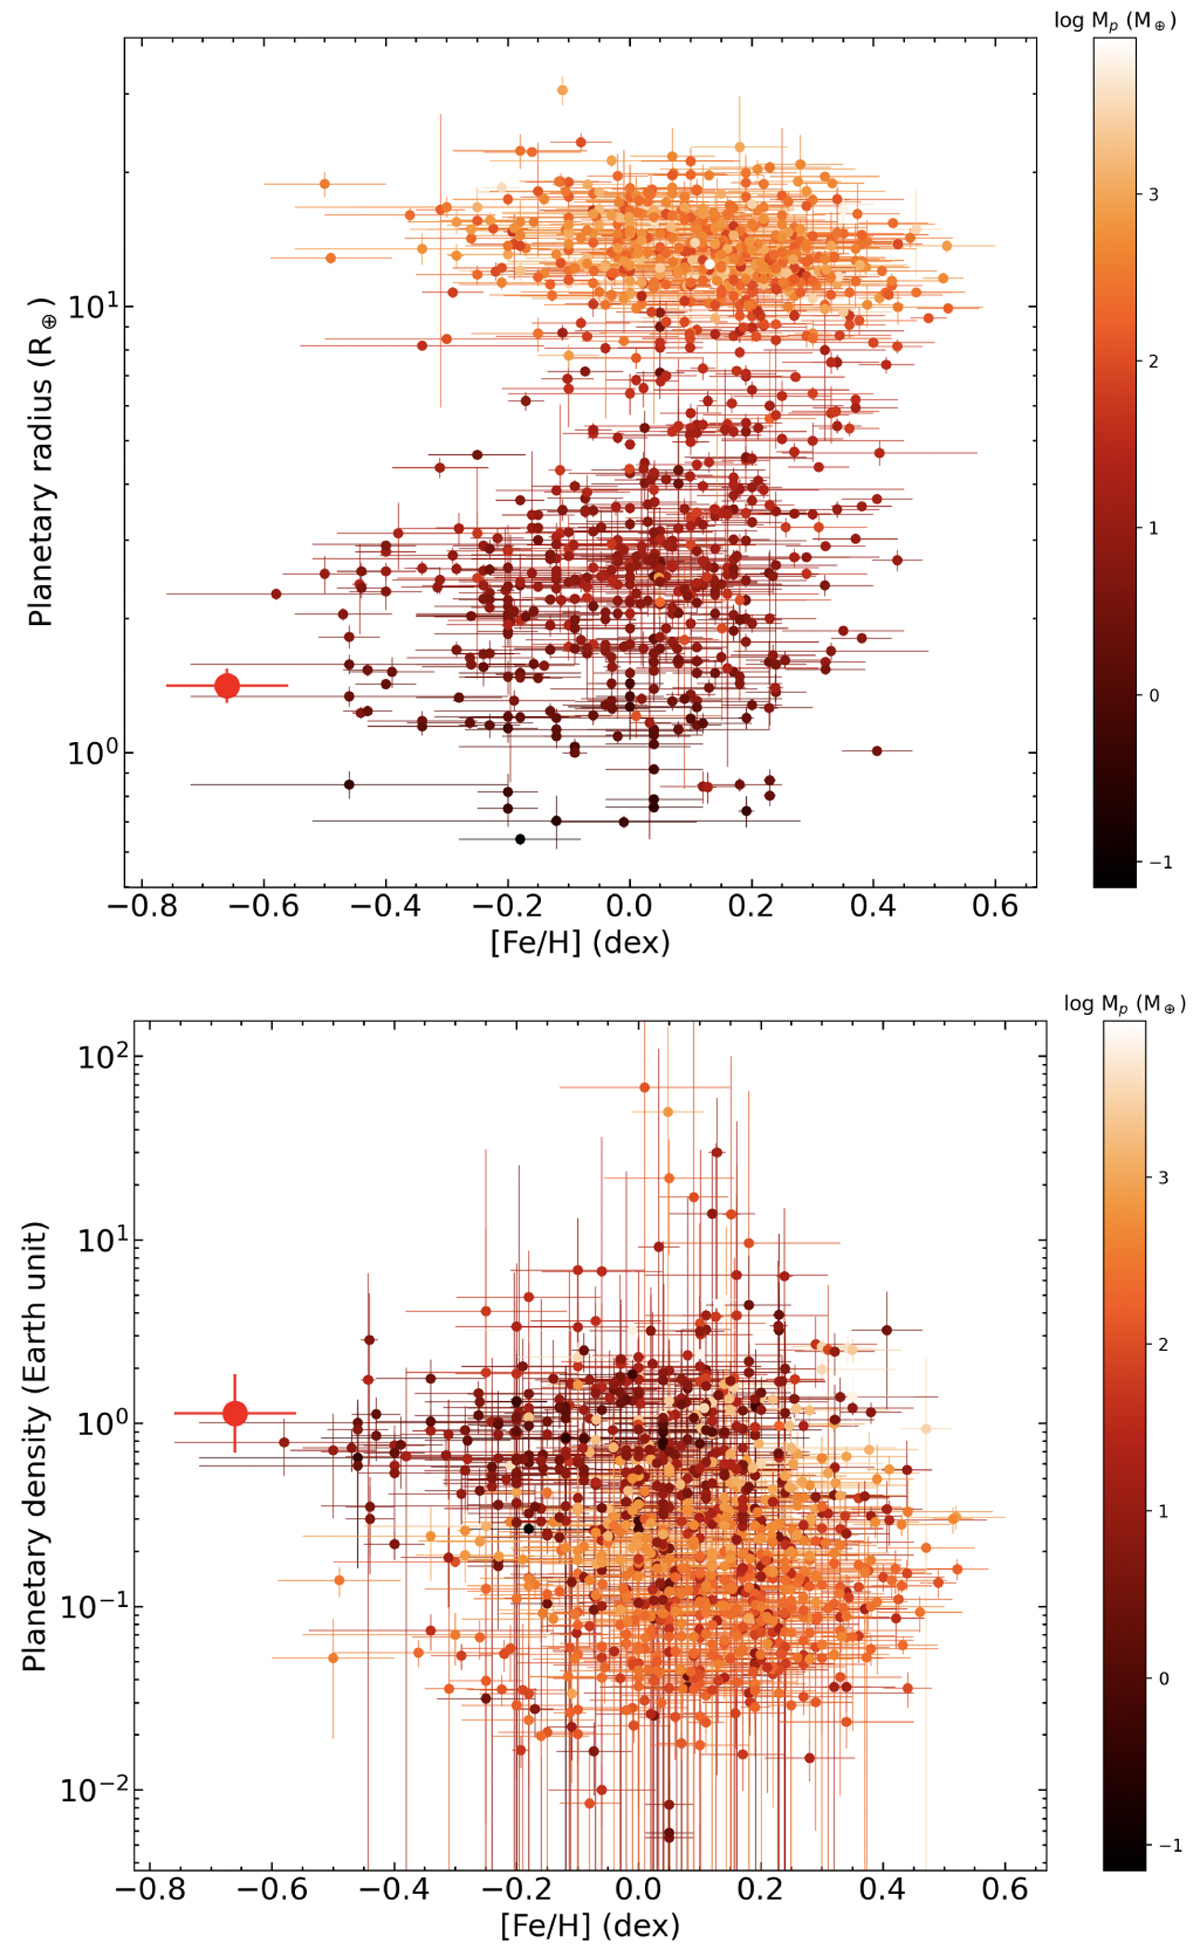
Stellar metallicity [Fe/H] plotted against planetary radius (top) and density (bottom). Over 1000 exoplanets are plotted with their masses (on logarithmic scale) color-coded (darker implies lower planetary mass). These data are taken from the NASA Exoplanet Archive database. GJ7 b is depicted by the red point. The vertical axes are on a logarithmic scale.
Current usage metrics show cumulative count of Article Views (full-text article views including HTML views, PDF and ePub downloads, according to the available data) and Abstracts Views on Vision4Press platform.
Data correspond to usage on the plateform after 2015. The current usage metrics is available 48-96 hours after online publication and is updated daily on week days.
Initial download of the metrics may take a while.