Fig. 16
Download original image
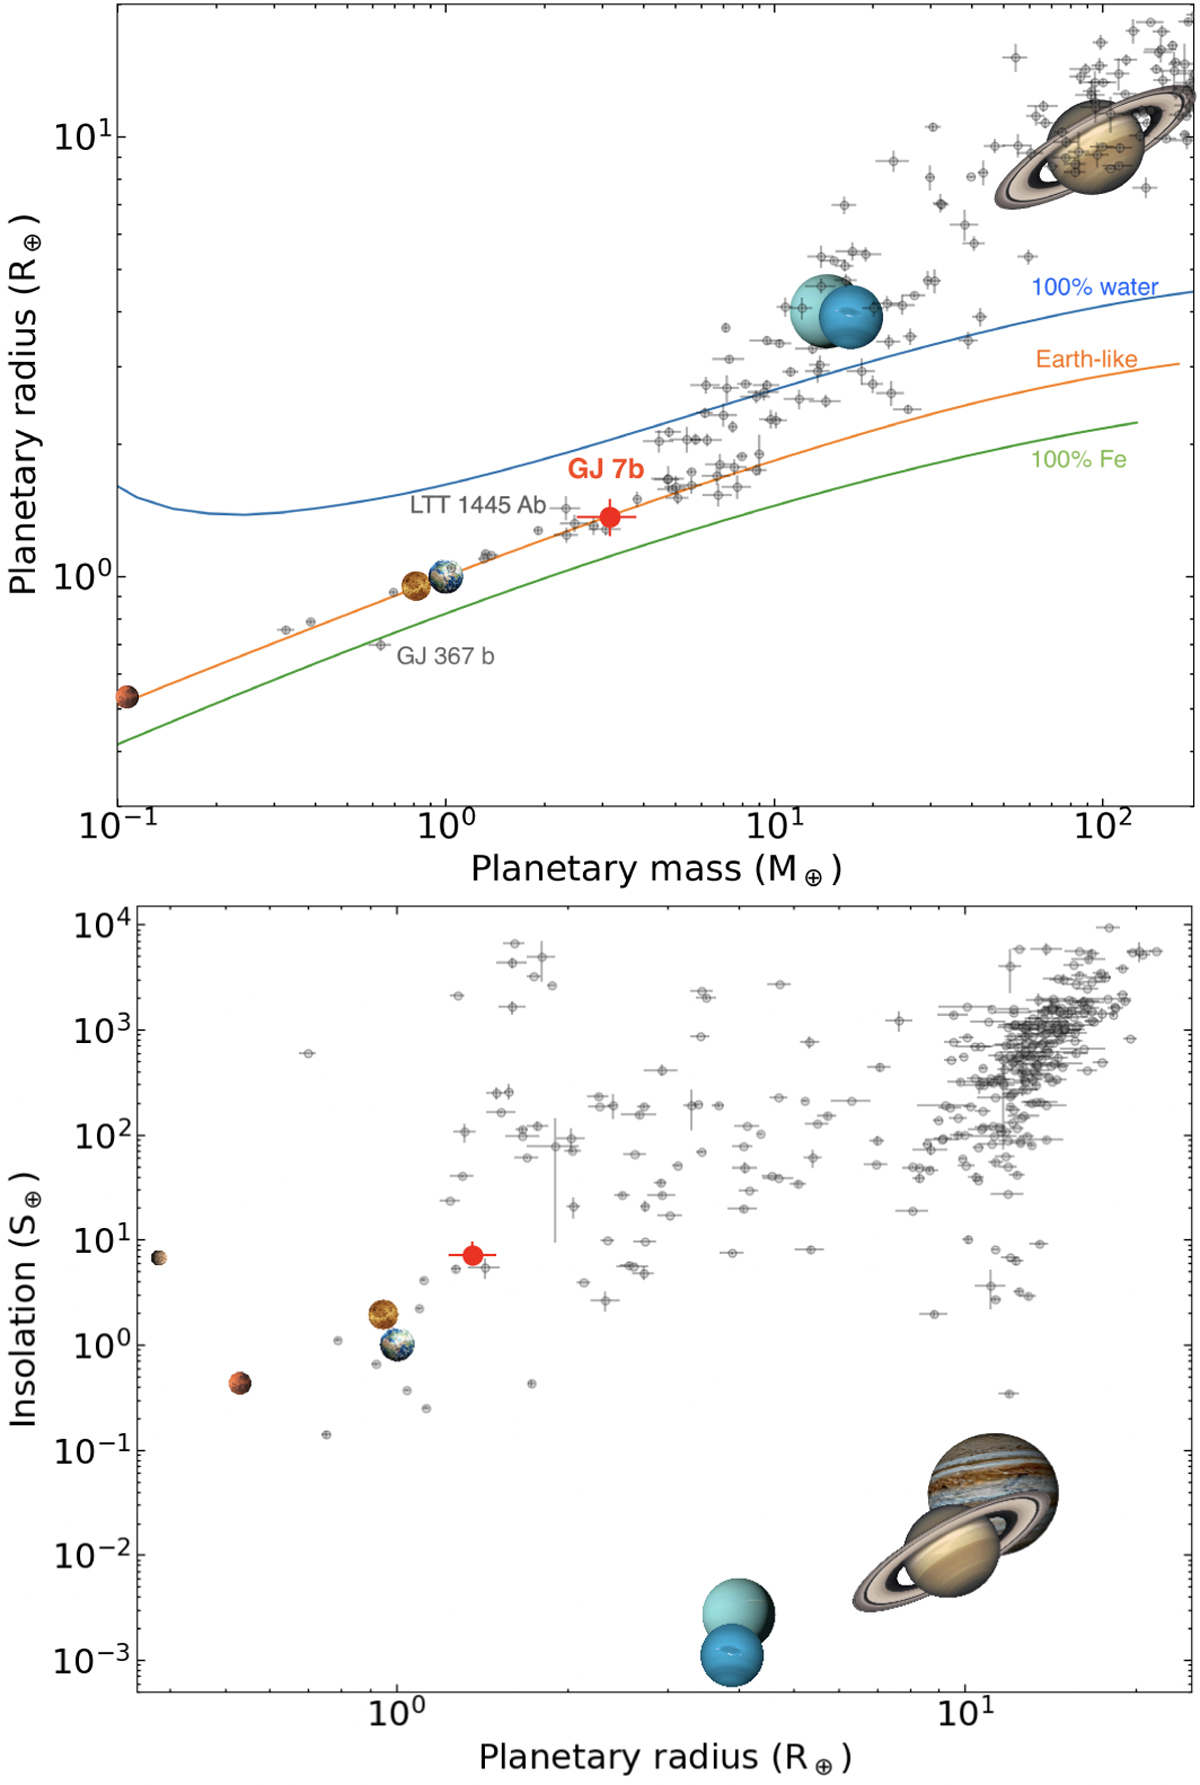
Top: planetary mass–radius diagram, including all known exoplanets with a radius and a mass constrained to a precision better than 12% (gray, open circles). GJ7 b is depicted by the red circle. Interior models of different compositions (Zeng et al. 2019) are shown by the solid colored lines. Two other planets discussed in the text are labeled. Bottom: planetary insolation plotted as a function of planetary radius for the same planets. The eight planets of the Solar System are shown as a reference. All axes are on a logarithmic scale.
Current usage metrics show cumulative count of Article Views (full-text article views including HTML views, PDF and ePub downloads, according to the available data) and Abstracts Views on Vision4Press platform.
Data correspond to usage on the plateform after 2015. The current usage metrics is available 48-96 hours after online publication and is updated daily on week days.
Initial download of the metrics may take a while.