Fig. 3
Download original image
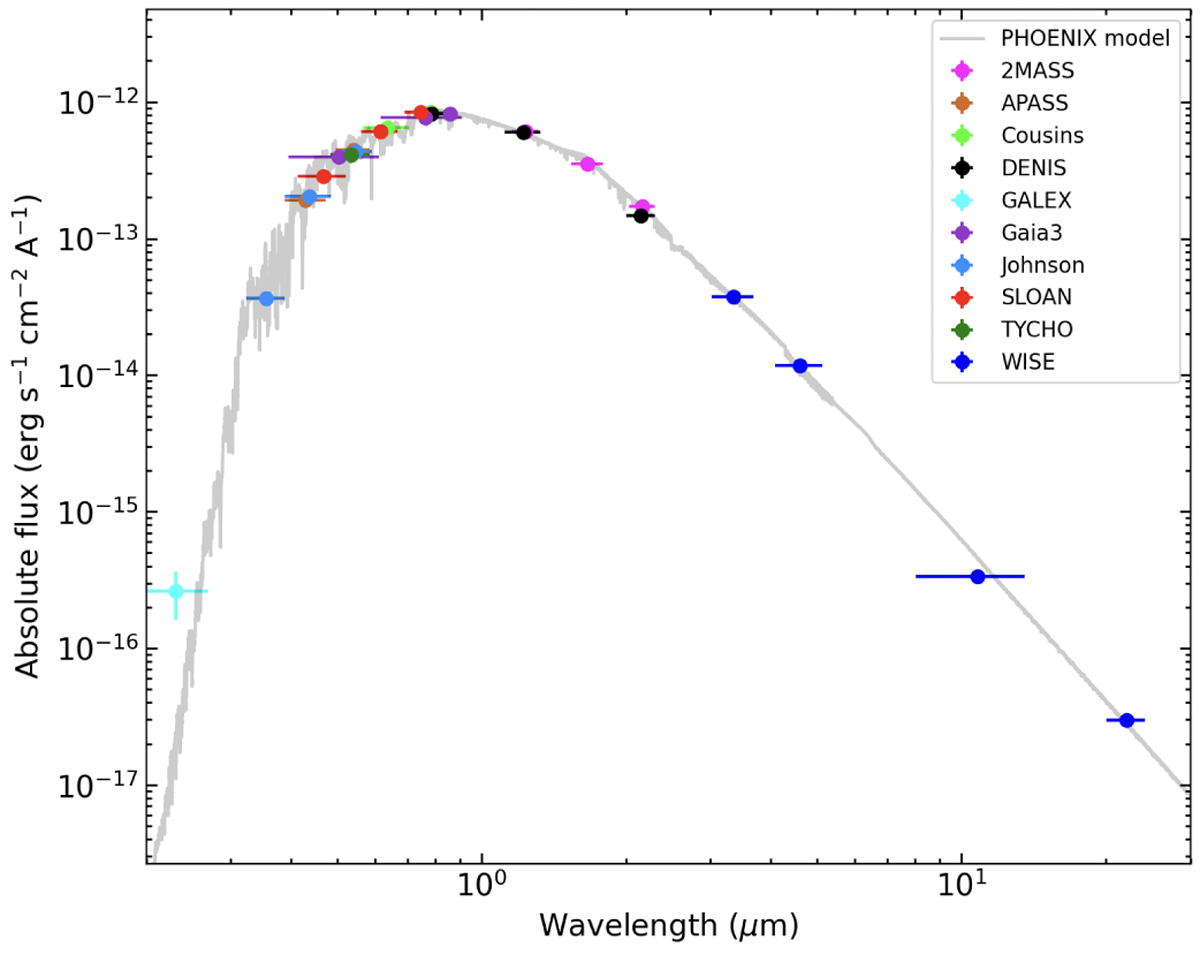
Photometric spectral energy distribution of GJ7 (circles). The PHOENIX solar-metallicity model (Teff = 3800 K, log g∗ = 5.0 cm s−2) is shown by the gray line normalized to the observed fluxes between 0.8 and 1.6 μm (Husser et al. 2013). Photometric error bars are included, although for most of the wavelengths they have the size of the symbol. The horizontal errors account for the effective width of the filters. At short wavelengths, GJ7 exhibits flux excesses with respect to the photospheric emission indicative of some stellar activity, while at the longest wavelengths, there are no obvious infrared flux excesses. Both axes are on a logarithmic scale.
Current usage metrics show cumulative count of Article Views (full-text article views including HTML views, PDF and ePub downloads, according to the available data) and Abstracts Views on Vision4Press platform.
Data correspond to usage on the plateform after 2015. The current usage metrics is available 48-96 hours after online publication and is updated daily on week days.
Initial download of the metrics may take a while.