Fig. 5
Download original image
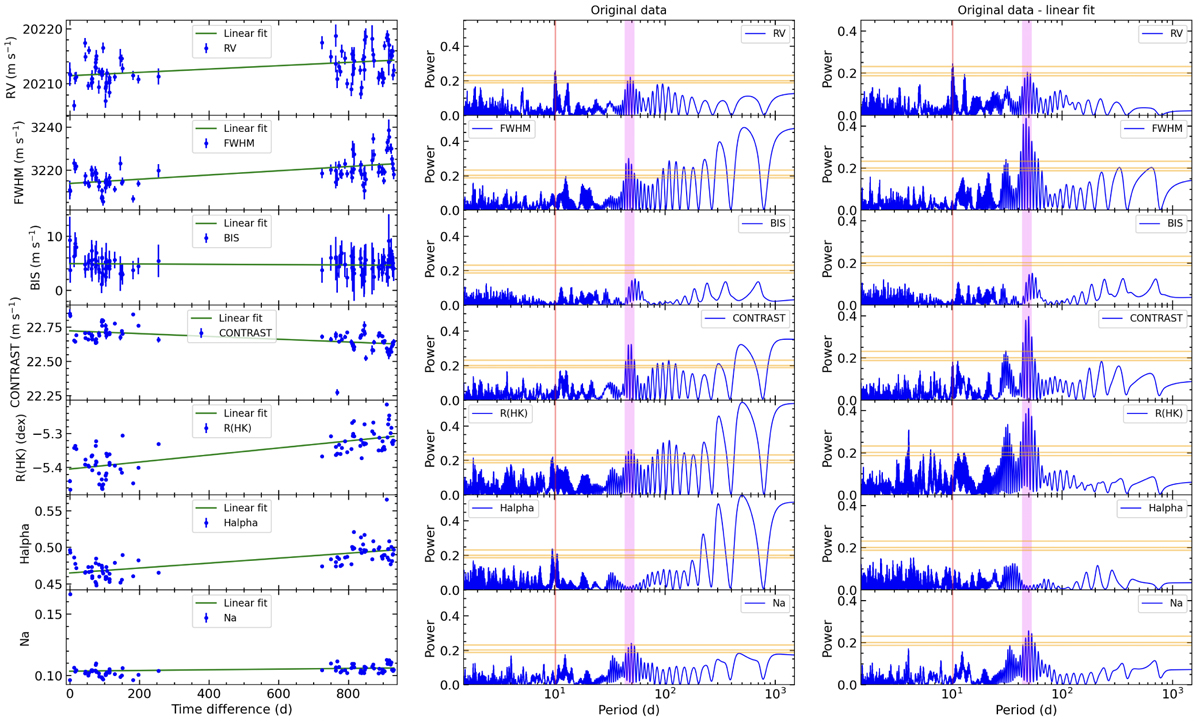
Left: ESPRESSO data (blue dots) and their linear trend (green line). Middle and right columns: GLS periodograms of the original data and data corrected for the linear trend. The vertical red line stands for the orbital period of the transiting planet GJ7 b, while the pink band indicates the most likely rotation period of the parent star. The 0.1%, 5%, and 10% FAP levels are plotted with horizontal orange lines.
Current usage metrics show cumulative count of Article Views (full-text article views including HTML views, PDF and ePub downloads, according to the available data) and Abstracts Views on Vision4Press platform.
Data correspond to usage on the plateform after 2015. The current usage metrics is available 48-96 hours after online publication and is updated daily on week days.
Initial download of the metrics may take a while.