Open Access
Fig. 9
Download original image
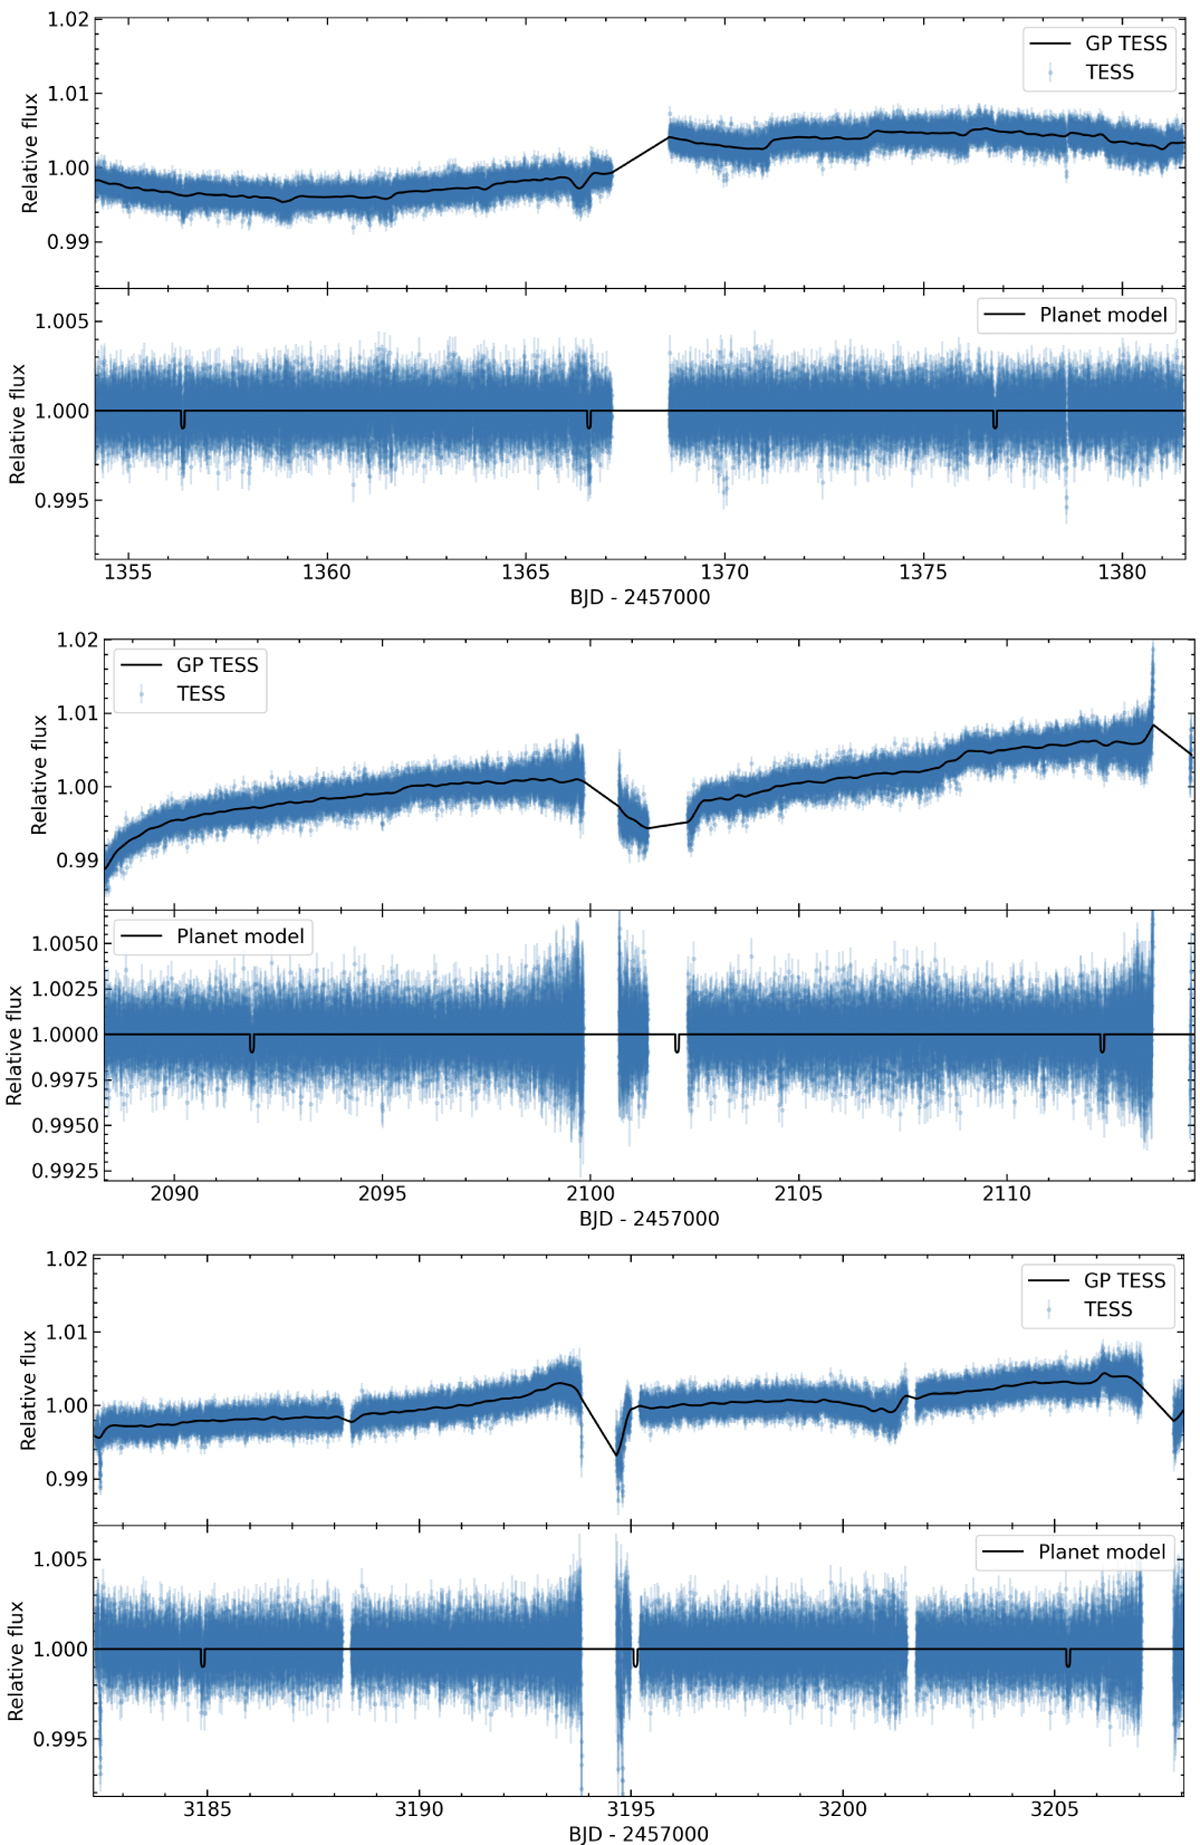
TESS SAP fluxes of GJ7 from sectors 2 (top), 29 (middle), and 69 (bottom). Top: modeled covariance function used to flatten the data (black curves) together with the original SAP fluxes (blue points). Bottom: flattened TESS light curves (blue points) and the location of GJ7 b’s transits (black line) registered by TESS.
Current usage metrics show cumulative count of Article Views (full-text article views including HTML views, PDF and ePub downloads, according to the available data) and Abstracts Views on Vision4Press platform.
Data correspond to usage on the plateform after 2015. The current usage metrics is available 48-96 hours after online publication and is updated daily on week days.
Initial download of the metrics may take a while.